
Fig. 6
- ID
- ZDB-FIG-200810-16
- Publication
- Asokan et al., 2020 - Long-term in vivo imaging reveals tumor-specific dissemination and captures host tumor interaction in zebrafish xenografts
- Other Figures
- All Figure Page
- Back to All Figure Page
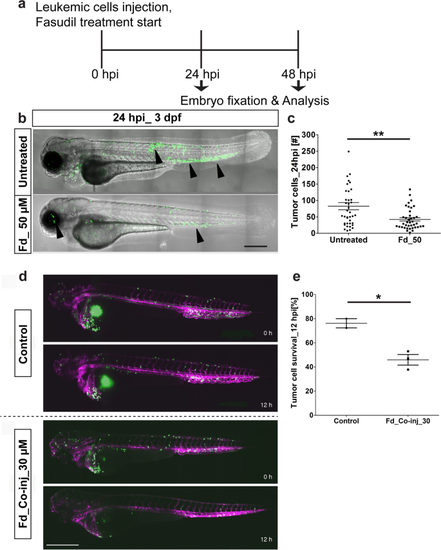
Effect of Fasudil on leukemic cells in the eZXM. Validation of the eZXM with the ROCK1 inhibitor Fasudil. (a) Schematic diagram depicting the experimental design: Leukemic cells (in green) were injected at 48 hpf, followed by the start of the Fasudil treatment to half cohort of the injected embryos and the other half were maintained in the normal E3 medium (control: untreated). At 24 hpi, few embryos were fixed and analyzed for tumor survival and at 48 hpi, remaining embryos were fixed and analyzed; (b) 50 µM Fasudil treatment (bottom) of the eZXM revealed a significant reduction (black arrowheads) in eGFP labeled leukemic cells (in green) at 24 hpi compared to untreated controls (top). (c) Quantification of tumor cells at 24 hpi showed a decrease in tumor cell number in 50 µM Fasudil-treated embryos [N = 40 embryos]. (d) Frames from the time-lapse movies showed dissemination of eGFP-tagged leukemic cells (in green) inside the eZXM expressing the vasculature marker Tg(kdrl:Hsa.HRAS-mCherry) (magenta) at the beginning of the experiment (0 h) and after 12 h (12 h) in treated and untreated fish. (e) Quantified survival rate of the leukemic cells as observed from the in vivo time-lapse movies (right). Scale bar 500 µm. (c, e) Plots represent means ± sem. Statistical analyses: (c) two-tailed Mann–Whitney’s U-test, (e) Welch Two Sample t-test. |