
Fig. 1
- ID
- ZDB-FIG-200810-11
- Publication
- Asokan et al., 2020 - Long-term in vivo imaging reveals tumor-specific dissemination and captures host tumor interaction in zebrafish xenografts
- Other Figures
- All Figure Page
- Back to All Figure Page
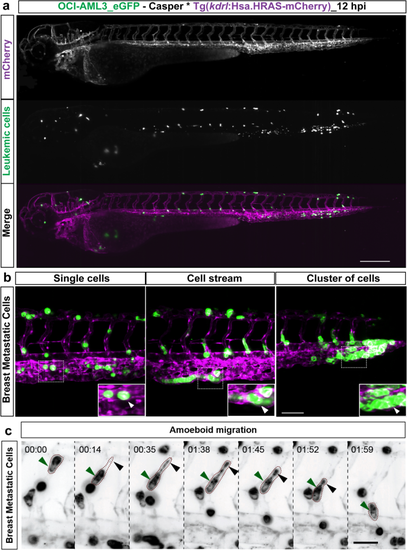
Dissemination and migration modes of tumor cells. (a) Snapshot from time-lapse movie of eZXM expressing the vascular marker Tg(kdrl:Hsa.HRAS-mCherry) in casper background (magenta label) injected with eGFP labeled leukemic cells (OCI-AML3_eGFP) (green label). The cells disseminated throughout the embryo. Scale bar: 500 µm. (b) High-magnification SPIM revealed diverse migratory modes of breast tumor cells. Representative images of tumor cells migrating either as single cells (left), loosely attached cell streams (center), or cluster of cells (right) indicated by white arrowheads. Insets showed the higher magnification of dotted boxes; Vasculature in magenta, breast tumor cells in green; scale bar 100 µm. (c) A breast tumor cell (MDA-MB-231, green label, green arrowheads) migrating through an intersegmental vessel (magenta label) in an amoeboid fashion (as indicated by dashed brown border). The cell formed a large protrusion, with a filopodia-like arm at the trailing end (black arrowheads). Time shown as h:min, scale bar 50 μm. |