
Fig. 5
- ID
- ZDB-FIG-200810-15
- Publication
- Asokan et al., 2020 - Long-term in vivo imaging reveals tumor-specific dissemination and captures host tumor interaction in zebrafish xenografts
- Other Figures
- All Figure Page
- Back to All Figure Page
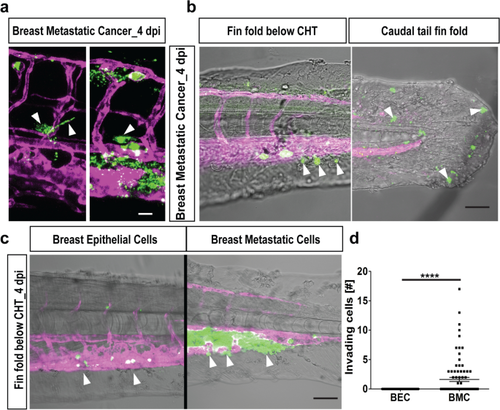
Extravasation and invasion of tumor cells. (a) Representative images of breast cancer cells (in green) initiating extravasation through the vasculature (in magenta) by forming protrusions (left, white arrowheads). These protruding cells later pushed the entire cellular content into the surrounding tissue (right, white arrowhead). Scale bar 20 µm. (b) Breast metastatic cells (in green) invaded the avascular tail region (vasculature in magenta). Two representative images of invading tumor cells (white arrowheads) in the fin-fold below the CHT region (left) and caudal tail fin-fold (right). Scale bars: 150 µm. (c) Representative images of invasion of cells out of the vasculature (in magenta) below CHT. Breast epithelial cells (in green) did not invade below CHT (white arrowheads, left panel) while few of the breast metastatic cells (in green) showed invasion below CHT (white arrowheads, right panel). Scale bar: 150 µm. (d) Quantification at 4 dpi revealed significant tail invasion of the breast metastatic cells (BMC) over breast epithelial cells (BEC) [N = 80 embryos each]. Plots represent means ± sem. Statistical analyses: two-tailed Mann–Whitney’s U-test. |