
Fig. 2
- ID
- ZDB-FIG-200810-12
- Publication
- Asokan et al., 2020 - Long-term in vivo imaging reveals tumor-specific dissemination and captures host tumor interaction in zebrafish xenografts
- Other Figures
- All Figure Page
- Back to All Figure Page
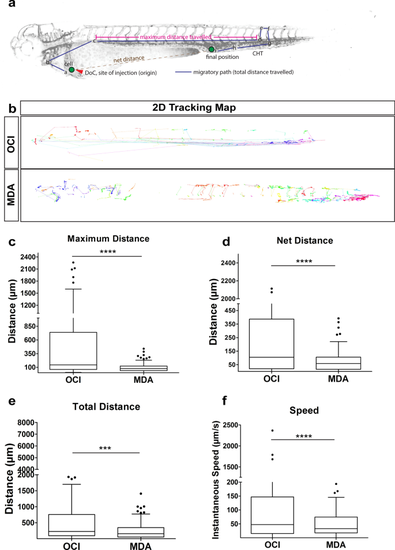
Tumor cell tracking revealed dynamics of xenografted cells. (a) Schematic of the quantified dissemination characteristics of a xenografted cell (green). DoC Duct of Cuvier, CHT caudal hematopoietic tissue. (b) 2D tracking map of the migratory path taken by every cell in vivo using semi-automated tracking analysis of the SPIM time-lapse movies. The tracking map revealed circulatory paths of leukemic cells (OCI, top), short migratory paths of breast tumor cells (MDA, bottom). Each color represented an individual cell. (c–f) Representative plot of R-analysis of the cell tracking revealed that (c) the maximum distance between any two time points was higher in leukemic cells (OCI) compared to either breast tumor cells (MDA). (d) The net distance was significantly higher for leukemic cells (OCI) compared to breast tumor cells (MDA (e) Leukemic cells (OCI) covered a significantly greater total distance compared to breast tumor cells (MDA). (f) Intravascular speed measurements in both cell types: breast tumor cells (MDA), and leukemic cells (OCI) revealed that OCI showed fastest migration. (c–f) Plots represent means ± sem.[N = 3 embryos; for each embryo ~ 150 to 200 cells were analyzed] Statistical analyses: (c–f) Kruskal–Wallis one-way analysis of variance were performed followed by post hoc Dunn’s method for multiple comparisons. Multiple comparisons: (c–f) OCI vs. MDA. |