
Fig. 3
- ID
- ZDB-FIG-200810-13
- Publication
- Asokan et al., 2020 - Long-term in vivo imaging reveals tumor-specific dissemination and captures host tumor interaction in zebrafish xenografts
- Other Figures
- All Figure Page
- Back to All Figure Page
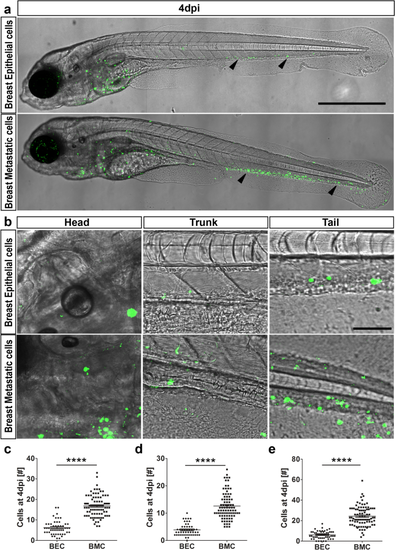
Dissemination of epithelial versus metastatic cells. (a) At 4 dpi, breast epithelial cell (BEC) numbers were drastically reduced compared to breast metastatic cells (BMC), as indicated by black arrowheads. Both breast epithelial and breast metastatic cells were depicted in green on a transmission image of zebrafish. Scale bar 500 µm. (b) Representative images of head, trunk, and tail regions of both BEC and BMC with high magnifications. Scale bar 50 µm. (c–e) Quantifications of the cells at 4 dpi in all the regions. Head (c), trunk (d), and tail (e) showed that breast metastatic cells survived better in the eZXM [N = 80 embryos each]. In all the regions observed, the cell numbers were significantly higher for breast metastatic cells. (c–e) Plots represent means ± sem. Statistical analyses: two-tailed Mann–Whitney’s U-test. |