|
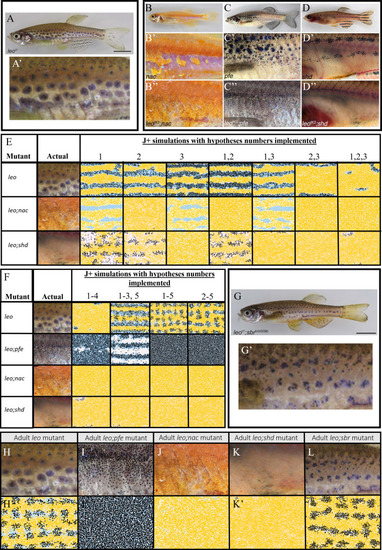
Using the model to generate predictions regarding the underlying effects of the <italic>leo</italic> mutant.(A–D) Adult leo, nac, pfe and shd respectively. (A’–D’) The flanks of leo, nac, pfe and shd respectively. (B’’–D’’) The flanks of leo;nac, leo;pfe and leo;shd respectively. (E) Example simulations where combinations of hypotheses 1–3 in the text are implemented. (F) Example simulations where combinations of hypotheses 1–5 in the text are implemented. Note that simulations of 1–5 are similar to simulations for 2–5, indicating that hypotheses one is not necessary to predict the leo phenotype. (G) Adult leo;sbr (G’) Flank of leo;sbr. (H–L) Adult mutants contrasting with (H’–L’) simulations using hypotheses 1–5 from the main text. (H–L) Flank of leo, leo;nac, leo;pfe, leo;shd and leo;sbr respectively. (H’–L’) Simulated images of leo, leo;pfe, leo;nac, leo;shd and leo;sbr respectively at stage J+. (A), (A’), (G), (G’), (H) and (L) from Fadeev et al., 2015, (B–D’’), (I–K) from Irion et al., 2014 and are all licensed under CC-BY 4.0 (http://creativecommons.org/licenses/by/4.0).
|