FIGURE

Figure 9.

ID
ZDB-FIG-200731-25
Publication
Owen et al., 2020 - A quantitative modelling approach to zebrafish pigment pattern formation
Other Figures
All Figure Page
Back to All Figure Page
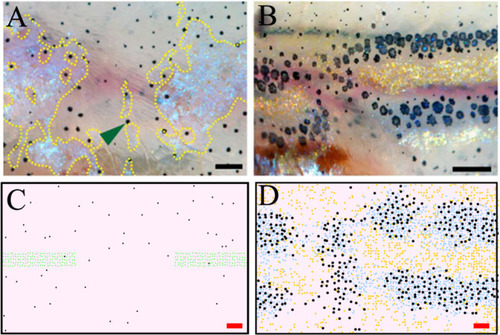
Figure 9.

Stripe regeneration post S-iridophore ablation.

(A) S-iridophores are ablated using pnp4a:NTR+Mtz at stage PB (B) Stripe development in wild-type fish following S-iridophore ablation. Xanthophores are associated with S-iridophore interstripe. Melanophores aggregate around the new interstripe. (CD) A representative simulation of S-iridophore ablation and subsequent development. For clarity, dense S-iridophores are displayed in green in (C). Scale bar is 0.25 mm in all images. Experimental images (AB) are reproduced from Patterson and Parichy, 2013 and licensed under CC-BY 4.0 (http://creativecommons.org/licenses/by/4.0).

Expression Data

Expression Detail
Antibody Labeling
Phenotype Data

Phenotype Detail
Acknowledgments
This image is the copyrighted work of the attributed author or publisher, and ZFIN has permission only to display this image to its users. Additional permissions should be obtained from the applicable author or publisher of the image. Full text @ Elife