|
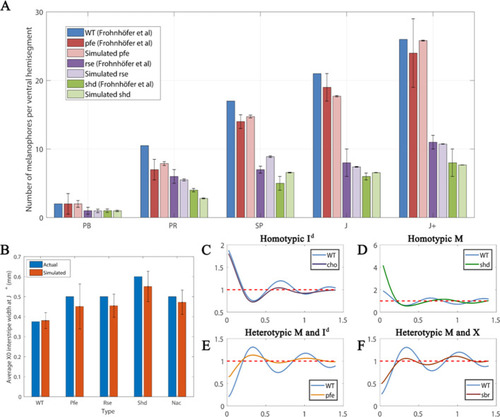
Quantitative analyses.(A) Number of melanocytes per ventral hemisegment. Quantification of melanocytes. A comparison of melanocyte numbers between mutants and WT seen in our simulations and data recreated from Frohnhöfer et al., 2013. For each stage, our simulated number of melanocytes was normalised by the WT number in data by Frohnhöfer et al., 2013. (The number of animals used for counting was at least five for each measurement point.) The number of simulations was 100. Error bars indicate the standard deviation. There is no error bar for WT, since WT data was used to normalise the data. (B) X0 interstripe width. A comparison of X0 stripe width in 100 simulations with X0 stripe width in real mutants (taken from representative images; Frohnhöfer et al., 2013). The darker bars depict experimental data, lighter bars depict our simulated data. Error bars indicate the standard deviation. Since there is only one image for each of the respective mutants, there is no error bar for actual (real experimental data). (C–F) PCF for different cell types averaged over 100 simulations using the square uniform PCF (Gavagnin et al., 2018). The spatial pair correlation as a function of distance for (C) dense S-iridophores only (D) melanocytes only, (E) melanocytes and dense S-iridophores, (F) melanocytes and xanthophores. Experimental data in (A) is reproduced from Frohnhöfer et al., 2013.
|