FIGURE

Figure 8.

ID
ZDB-FIG-200731-24
Publication
Owen et al., 2020 - A quantitative modelling approach to zebrafish pigment pattern formation
Other Figures
All Figure Page
Back to All Figure Page
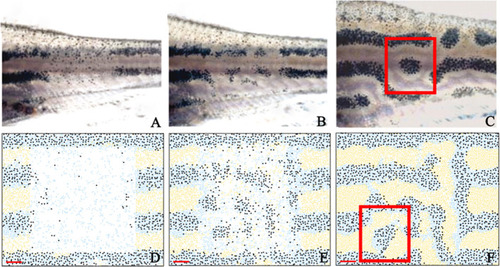
Figure 8.

Stripe regeneration simulations.

(AC) Regeneration of new pigment producing cells 7, 14 and 21 days respectively after a small rectangular window of cells in the adult WT stripes are completely ablated (Patterson and Parichy, 2013). (DF) A representative simulation of the regeneration of an adult zebrafish 7, 14 and 21 days after a simulated ablation has occurred. Scale bar is 0.25 mm in all images. Experimental images (AC) are reproduced from Yamaguchi et al., 2007. Copyright (2007) National Academy of Sciences U.S.A.; these images not covered by the CC-BY 4.0 licence and further reproduction of this panel would need permission from the copyright holder.

Expression Data

Expression Detail
Antibody Labeling
Phenotype Data

Phenotype Detail
Acknowledgments
This image is the copyrighted work of the attributed author or publisher, and ZFIN has permission only to display this image to its users. Additional permissions should be obtained from the applicable author or publisher of the image. Full text @ Elife