|
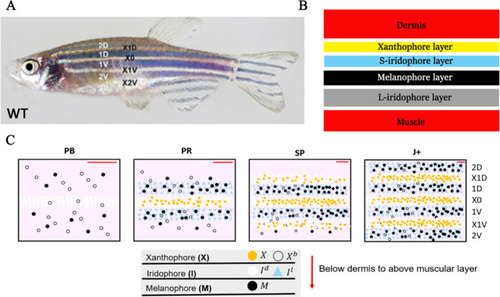
WT stripe composition and development.(A) An adult wild type (WT) fish. Stripes and interstripes are labelled according to their order of temporal appearance. X0 is the first interstripe to appear. 1D and 1V (D - Dorsal, V- Ventral) are the first two stripes to appear. X1D and X1V are the next two interstripes to appear and so on. Image reproduced from Frohnhöfer et al., 2013 and licensed under CC-BY 4.0 (https://creativecommons.org/licenses/by/4.0). (B) Summary of pigment cell distribution in adult zebrafish. The cells in the xanthophore, S-iridophore, melanophore and L-iridophore layers consist of xanthophores and xanthoblasts, melanophores, S-iridophores and L-iridophores, respectively. Adapted from Hirata et al., 2003. (C) Schematic of WT patterns on the body of zebrafish. Stages PB, PR, SP, J+ correspond to developmental stages described in 3. Patterns form sequentially outward from the central interstripe, labelled X0, with additional dorsal stripes and interstripes labelled 1D, X1D, 2D, X2D from the centre (horizontal myoseptum) dorsally outward (similarly, ventral stripes and interstripes are labelled 1V, X1V, 2V, etc).
|