|
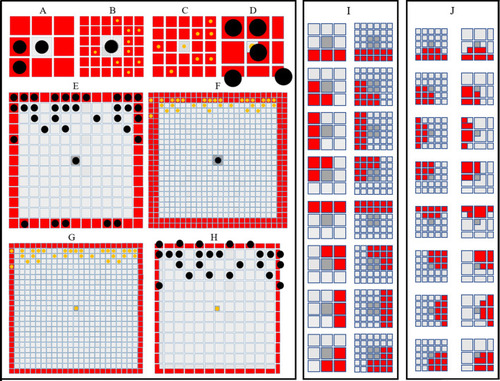
Simulating short- and long-range interactions.(A–F) Comparing the number of cells in the short (A–D) and long (E–F) range distance (0.04 mm) from a central site, on different domain types. M are represented as black circles. X are represented as yellow circles. (A–B) A visualisation of sites (marked in red) local to central melanocyte on the (A) melanocyte domain and (B) xanthophore domain.(C–D) A visualisation of sites (marked in red) local to central xanthophore on the (C) xanthophore domain and (D) melanocyte domain. (E–F) A visualisation of sites (marked in red) long-distance to central melanocyte on the (E) melanocyte domain and (F) xanthophore domain.(G–H) A visualisation of sites (marked in red) long-distance to central xanthophore on the (G) xanthophore domain and (H) melanocyte domain. (I) Melanophore movement with respect to local neighbours. If a melanophore located in a central position (marked in dark grey) attempts to move, the melanophore will consider neighbours in all sites marked in red on the melanophore domain (left), xanthophore and S-iridophore domain (right). (J) Movement on xanthophore/iridophore domain with respect to local neighbours. If a xanthophore/iridophore located in a central position (marked in dark grey) attempts to move, the xanthophore/iridophore will consider neighbours in all sites marked in red on the xanthophore and S-iridophore domain (left), melanophore domain (right).
|