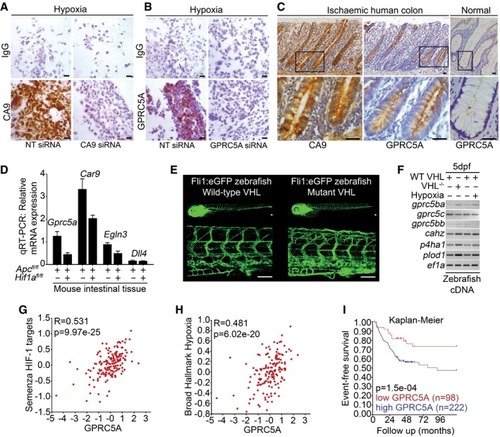
GPRC5A is hypoxia/HIF‐induced <italic>in vivo</italic>
Expression of CA9 and GPRC5A in formalin‐fixed paraffin‐embedded hypoxic SW620 cells by IHC. Reduced CA9 and GPRC5A expressions with siRNA confirm antibody specificity (scale bars: 200 μm).
IHC analysis of serial sections from human colorectal tissue from patients with mesenteric ischaemia (strangulated colon). GPRC5A is co‐expressed with CA9 in the colonic epithelial cells (scale bars: 50 μm).
Quantitative RT–PCR analysis of mouse intestinal tissue. Gene expression was normalised to housekeeping gene Tbp. Raw data from three independent experiments (n = 3 mice) are shown (error bars ± SEM).
Tg[fli1:eGFP; vhl−/−] and Tg[fli1:eGFP] zebrafish embryos (5 days post‐fertilisation) demonstrate excessive angiogenesis and increased expression of HIF target genes (scale bars: 100 μm).
gprc5ba was induced in vhl mutant zebrafish embryos and fli1:eGFP zebrafish embryos exposed to 5% O2 (vs. normoxia) for 24 h (RT–PCR).
Bioinformatic analysis of transcriptomics dataset GSE24551. Gene set analyses reveal GPRC5A mRNA strongly correlated with HIF/hypoxia gene signatures. GSEA datasets used were Semenza_HIF1_Targets (M12299) Broad_Hallmark_Hypoxia (M5891). Analysis was performed using R2 (http://r2.amc.nl).
Kaplan–Meier curve following analysis of transcriptomics dataset GSE24551. Event‐free survival is significantly reduced in patients with tumours expressing high levels of GPRC5A mRNA. Analysis was performed using R2 (http://r2.amc.nl).
Data information: Level adjustments were made to images in Adobe Photoshop post‐acquisition for clarity (equal changes applied to the entire image). Representative examples of n = 3 independent experiments are shown.Source data are available online for this figure.
This image is the copyrighted work of the attributed author or publisher, and
ZFIN has permission only to display this image to its users.
Additional permissions should be obtained from the applicable author or publisher of the image.
Full text @ EMBO Mol. Med.
Your Input Welcome
Thank you for submitting comments. Your input has been emailed to ZFIN curators who may contact you if
additional information is required.
Oops. Something went wrong. Please try again later.