
4
- ID
- ZDB-FIG-190723-1013
- Publication
- Greenhough et al., 2018 - Cancer cell adaptation to hypoxia involves a HIF-GPRC5A-YAP axis
- Other Figures
- All Figure Page
- Back to All Figure Page
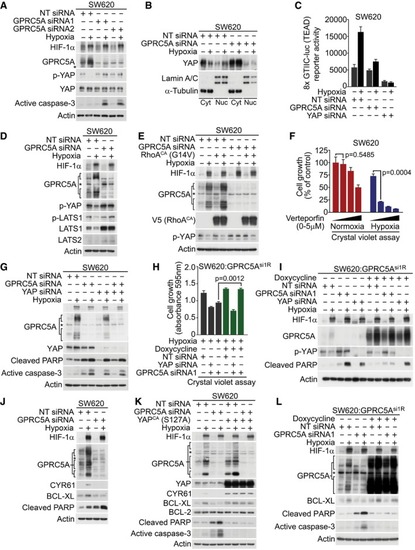
Hypoxia‐induced YAP stabilisation via Ser397 dephosphorylation was abrogated in GPRC5A‐depleted cells. Hypoxia‐induced nuclear localisation of YAP was attenuated in GPRC5A‐depleted cells. Hypoxia stimulated TEAD activity (8× GTIIC‐luc reporter), but this effect was reduced by GPRC5A depletion. A representative triplicate experiment is shown ( Hypoxia reduced LATS activity and expression, but this was prevented by GPRC5A depletion. Constitutively active RhoA (G14V) expression restored YAP stabilisation (Ser397 dephosphorylation) by hypoxia in GPRC5A‐depleted cells. The YAP/TEAD inhibitor verteporfin selectively inhibited cancer cell survival in hypoxia by crystal violet assay ( YAP knockdown was sufficient to induce caspase‐3 activation/PARP cleavage in hypoxia and was not further enhanced by GPRC5A depletion. Crystal violet assays show that YAP was required downstream of GPRC5A to promote cell survival. GPRC5A‐depleted cells were rescued by expression of an siRNA‐resistant GPRC5A cDNA (GPRC5Asi1R), but this was prevented by co‐depletion of YAP ( Expression of an siRNA‐resistant GPRC5A rescued the critical phenotypes of GPRC5A depletion. GPRC5Asi1R expression prevented PARP cleavage in hypoxia as well as restoring hypoxia‐induced YAP stabilisation (Ser397 dephosphorylation); these phenotypes were reversed by YAP depletion. GPRC5A depletion attenuated hypoxia‐induced BCL‐XL expression. Constitutively active YAP (S127A) expression induced BCL‐XL expression and prevented caspase‐3 activation/PARP cleavage by GPRC5A depletion in hypoxia. GPRC5Asi1R expression restored BCL‐XL expression and prevented the appearance of cleaved caspase‐3 induced by GPRC5A depletion in hypoxia. |