
- Title
-
Cancer cell adaptation to hypoxia involves a HIF-GPRC5A-YAP axis
- Authors
- Greenhough, A., Bagley, C., Heesom, K.J., Gurevich, D.B., Gay, D., Bond, M., Collard, T.J., Paraskeva, C., Martin, P., Sansom, O.J., Malik, K., Williams, A.C.
- Source
- Full text @ EMBO Mol. Med.
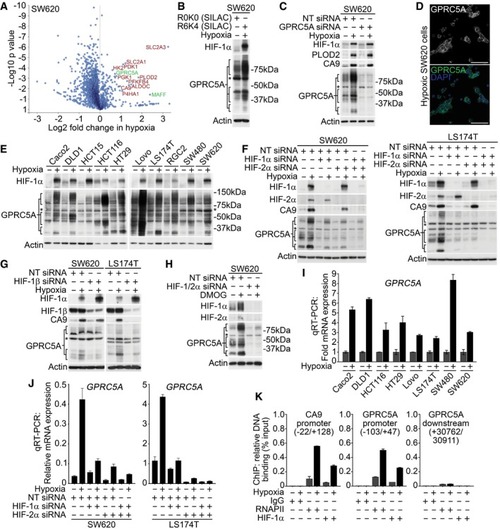
SILAC‐based proteomics data identify known (red) and novel (green) hypoxia‐induced proteins in SW620 cells. One‐sample Western blotting confirmed GPRC5A as a hypoxia‐induced protein in SILAC lysates. Validation of GPRC5A Western blot data using siRNA. *Non‐specific band of ˜60 kDa not depleted by GPRC5A siRNA. Confocal microscopy showing plasma membrane GPRC5A expression in hypoxic SW620 cells (scale bars: 75 μm). Western blotting showing GPRC5A upregulation by hypoxia in a panel of colorectal tumour cell lines. Basal & hypoxia‐induced GPRC5A protein expression was decreased by HIF‐1/2α depletion. Depletion of HIF‐1β decreased GPRC5A protein upregulation in hypoxia. Hypoxia mimetic DMOG induced HIF‐1/2α, CA9 and GPRC5A protein expression. Dual HIF‐1/2α depletion reduced GPRC5A induction by DMOG. qRT–PCR demonstrating that qRT–PCR demonstrating that HIF‐1/2α depletion decreased ChIP‐PCR analyses identify HIF‐1α binding to the |
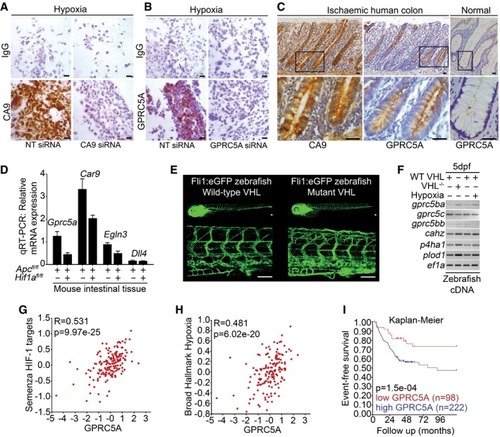
Expression of CA9 and GPRC5A in formalin‐fixed paraffin‐embedded hypoxic SW620 cells by IHC. Reduced CA9 and GPRC5A expressions with siRNA confirm antibody specificity (scale bars: 200 μm). IHC analysis of serial sections from human colorectal tissue from patients with mesenteric ischaemia (strangulated colon). GPRC5A is co‐expressed with CA9 in the colonic epithelial cells (scale bars: 50 μm). Quantitative RT–PCR analysis of mouse intestinal tissue. Gene expression was normalised to housekeeping gene Tg[ Bioinformatic analysis of transcriptomics dataset GSE24551. Gene set analyses reveal Kaplan–Meier curve following analysis of transcriptomics dataset GSE24551. Event‐free survival is significantly reduced in patients with tumours expressing high levels of |
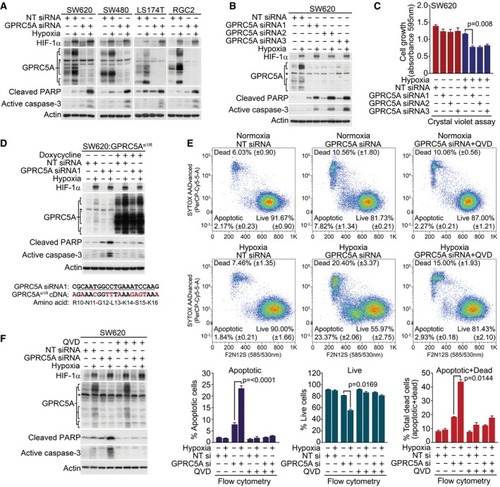
GPRC5A depletion markedly increases caspase‐3 activation/PARP cleavage during hypoxia. Three independent siRNA sequences targeting GPRC5A induce caspase‐3 activation/PARP cleavage during hypoxia. GPRC5A depletion reduces hypoxic cell growth/survival. Crystal violet cell assays show reduced cell growth/survival in GPRC5A‐depleted cells during hypoxia ( Expression of an siRNA‐resistant GPRC5A cDNA rescues hypoxic GPRC5A‐depleted cells from apoptosis. Upper: doxycycline‐induced expression of GPRC5Asi1R rescues increased caspase‐3/PARP cleavage induced by GPRC5A depletion in hypoxia. Lower: generation of an siRNA1‐resistant GPRC5A cDNA by synonymous mutations. GPRC5A depletion in hypoxia induces apoptosis as determined by the violet ratiometric membrane asymmetry probe/dead cell apoptosis assay and flow cytometry ( Caspase inhibitor QVD prevented caspase‐3 activation/PARP cleavage by GPRC5A depletion in hypoxia. |
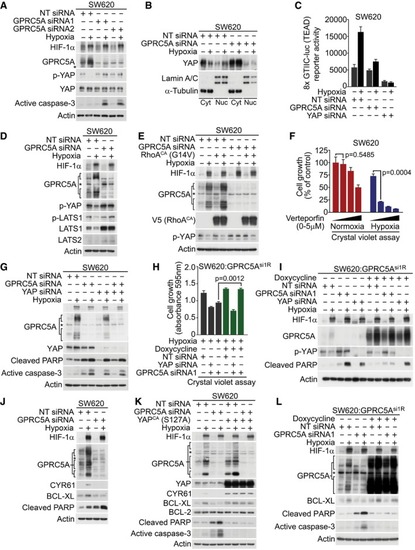
Hypoxia‐induced YAP stabilisation via Ser397 dephosphorylation was abrogated in GPRC5A‐depleted cells. Hypoxia‐induced nuclear localisation of YAP was attenuated in GPRC5A‐depleted cells. Hypoxia stimulated TEAD activity (8× GTIIC‐luc reporter), but this effect was reduced by GPRC5A depletion. A representative triplicate experiment is shown ( Hypoxia reduced LATS activity and expression, but this was prevented by GPRC5A depletion. Constitutively active RhoA (G14V) expression restored YAP stabilisation (Ser397 dephosphorylation) by hypoxia in GPRC5A‐depleted cells. The YAP/TEAD inhibitor verteporfin selectively inhibited cancer cell survival in hypoxia by crystal violet assay ( YAP knockdown was sufficient to induce caspase‐3 activation/PARP cleavage in hypoxia and was not further enhanced by GPRC5A depletion. Crystal violet assays show that YAP was required downstream of GPRC5A to promote cell survival. GPRC5A‐depleted cells were rescued by expression of an siRNA‐resistant GPRC5A cDNA (GPRC5Asi1R), but this was prevented by co‐depletion of YAP ( Expression of an siRNA‐resistant GPRC5A rescued the critical phenotypes of GPRC5A depletion. GPRC5Asi1R expression prevented PARP cleavage in hypoxia as well as restoring hypoxia‐induced YAP stabilisation (Ser397 dephosphorylation); these phenotypes were reversed by YAP depletion. GPRC5A depletion attenuated hypoxia‐induced BCL‐XL expression. Constitutively active YAP (S127A) expression induced BCL‐XL expression and prevented caspase‐3 activation/PARP cleavage by GPRC5A depletion in hypoxia. GPRC5Asi1R expression restored BCL‐XL expression and prevented the appearance of cleaved caspase‐3 induced by GPRC5A depletion in hypoxia. |
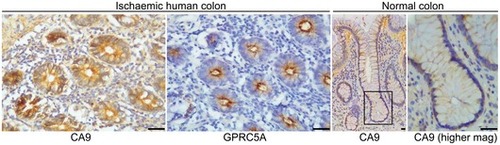
GPRC5A and CA9 immunohistochemistry from transverse sections of human colon from patients with mesenteric ischaemia (left panels) and CA9 immunohistochemistry from longitudinal sections of normal human colon. IHC staining confirmed high levels of CA9 and GPRC5A protein expression in hypoxic tissue (mesenteric ischaemia), and low levels of CA9 in normal tissue (scale bars: 50 μm). Level adjustments were made to images in Adobe Photoshop post‐acquisition for clarity (equal changes applied to the entire image). Related to Fig |