
Fig. 3
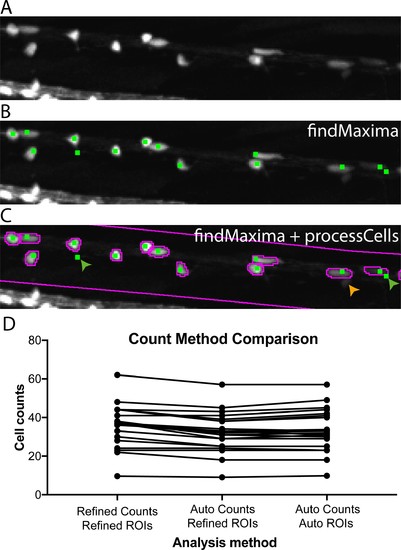
Automated cell counting allows for effective quantification of oligodendrocyte cell number. (A) Crop of dorsal spinal cord of 4 dpf Tg(mbp:EGFP) zebrafish larva acquired on VAST-SDCM. (B) Output of ImageJ’s findMaxima function (green dots), note that whilst not every cell is identified (e.g. the small dim cell indicated by orange arrow in C), some cells are identified multiple times (green arrows in C). (C) Output of findMaxima plus processCells function allows assessment of cell likeness, and removal of false positives, for example green arrows. (D) Comparison of count methods for individual fish, with ROIs and cell counts verified and corrected by a human, ROIs corrected by a human with automatic cell counts, and fully automated ROIs and cell counts. |