
Fig. 1
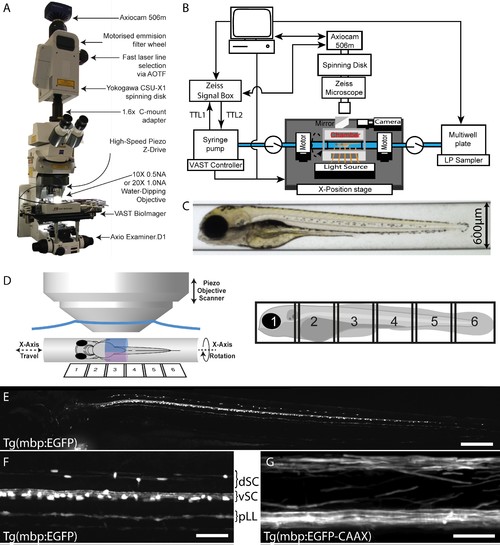
VAST-SDCM setup for rapid, automated image acquisition at subcellular resolution. (A) Overview of custom VAST BioImager and spinning-disk microscope setup, highlighting key components. (B) Schematic representation of hardware interaction between Zeiss SDCM, VAST BioImager and LP Sampler. (C) Representative brightfield image produced by VAST BioImager, showing a 4 dpf zebrafish embryo in a 600 µm glass capillary. (D) Illustration of relative setup of microscope objective and capillary. Note that the piezo range (400 µm) requires for two stacks (blue and magenta) to be acquired per tile of fish (6-tiles with 10% overlap required to image entire 4 dpf larva). (E) Maximum intensity projection of images of Tg(mbp:EGFP) zebrafish, following tiled merging of 6 z-stacks. Scale bar = 200 µm. (F) and G) Example images of mid-trunk region of Tg(mbp:EGFP) and Tg(mbp:EGFP-CAAX) fish imaged with 10 × 0.5 NA (3 × 3 binning) and 20 × 1 NA (1 × 1 binning) objectives respectively. Scale bars = 50 and 25 µm respectively). dSC = dorsal spinal cord, vSC = ventral spinal cord and pLL = posterior lateral line. |