
Fig. 8-S1
- ID
- ZDB-FIG-180910-14
- Publication
- Early et al., 2018 - An automated high-resolution in vivo screen in zebrafish to identify chemical regulators of myelination
- Other Figures
- All Figure Page
- Back to All Figure Page
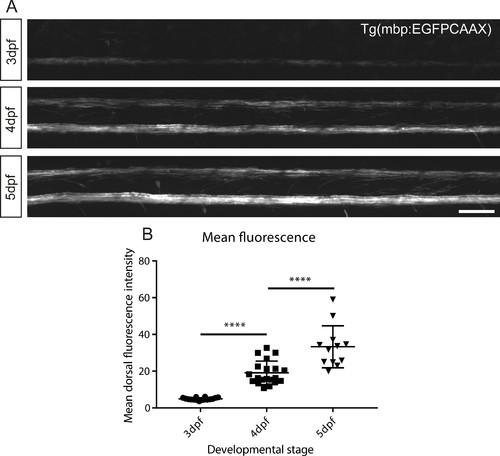
Automated fluorescent quantification of myelin during development. (A) Representative lateral views of the spinal cord in Tg(mbp:EGFP-CAAX) larvae, where EGFP is targeted to the membrane of oligodendrocytes, demonstrating a developmental increase in myelinated structures from 3 to 5 dpf in vivo. Scale bar, 50 μm. (B) Automated quantification of the mean fluorescence intensity within the dorsal region shows a significant increase from 3 to 4 dpf and from 4 to 5 dpf (One-way ANOVA with Tukey’s multiple comparisons test, p<0.0001 average fluorescent intensity (AU) from 3 to 4 dpf and 4–5 dpf). Error bars represent means ± s.d. |