
Fig. 2-S3
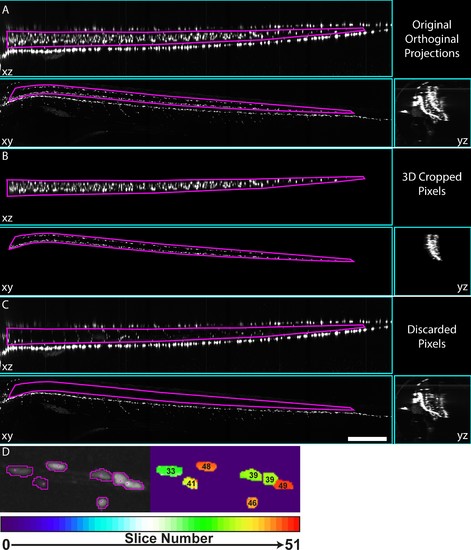
3D-Cropping of images of complex transgenic animal. (A) xz, xy, and yx maximum intensity projections of a 4 dpf Tg(mbp:nls-EGFP) animal, as presented to user for selection of ROI to be cropped in 3D. Magenta ROIs in xz and xy views show the user defined ROIs used for 3D crop. (B) and (C) Orthogonal maximum intensity projection views of pixels from within or outwith 3D ROI defined in A, for B and C respectively. Scale bar A-C = 250 µm. (D) Illustration of depth mapped image (right panel), where processCells selections are used to mask a maximum intensity depth projection, giving addition spatial information in absence of original 3D data. |