
Fig. 2
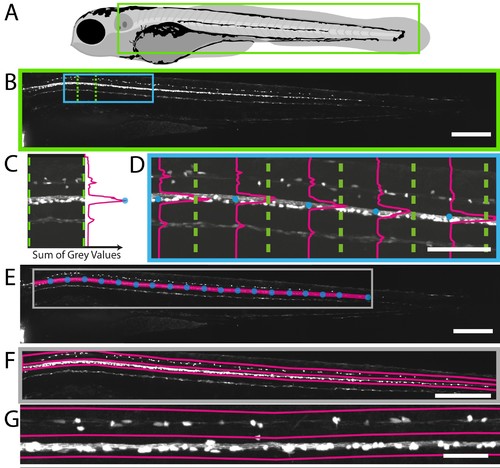
Fully automated ROI specification in Tg(mbp:EGFP) larval zebrafish. (A) Schematic overview of 4 dpf larvae, illustrating the region (green rectangle) of Tg(mbp:EGFP) animal imaged using VAST-SDCM (B). (C) Example fluorescence intensity profile from region demarcated by green dashed lines in B. Each point on the profile is a sum of the grey values in X for a given Y position between the green dashed lines. (D) Along the length of the spinal cord, each point of peak fluorescence is marked by a blue circle. The points identified in this way delineate the ventral spinal cord (E). This line was then used to set regions of interest for dorsal and ventral spinal cord (F) and higher magnification view in G). Scale bars B, E and F = 250 µm, D = 100 µm, and G = 50 µm. |