
Fig. 7
- ID
- ZDB-FIG-180910-12
- Publication
- Early et al., 2018 - An automated high-resolution in vivo screen in zebrafish to identify chemical regulators of myelination
- Other Figures
- All Figure Page
- Back to All Figure Page
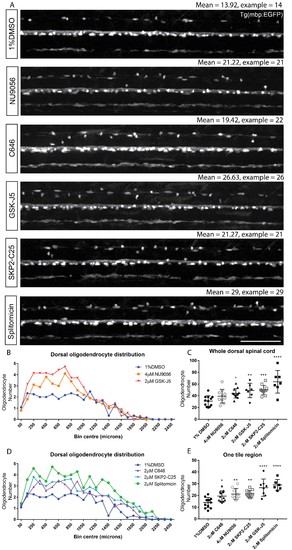
Automated region-specific analyses of identified hit compounds. (A) Representative single tile images of 4 dpf Tg(mbp:EGFP) larvae following treatment with the five hit compounds that increased oligodendrocyte number in our screen. Scale bar, 100 μm. Mean numbers of dorsal oligodendrocytes quantified for each treatment and in the examples shown are indicated above each corresponding image. (B) Plot of the anterior-posterior distribution of dorsal oligodendrocytes along the spinal cord demonstrates region-specific effects with NU9056 and GSK-J5 treatment, whereas C646, SKP2-C25 and splitomicin exhibit more consistent increases in cell number along the A-P axis (D). (C) Quantification of oligodendrocyte number throughout the entire dorsal region shows lower sensitivity for identifying compounds with region-specific effects compared with quantification within one tile region (second of five tiles) (E). *p<0.05, **p<0.01, ***p<0.001, ****p<0.0001. Error bars represent means ± s.d. |