
Fig. 7
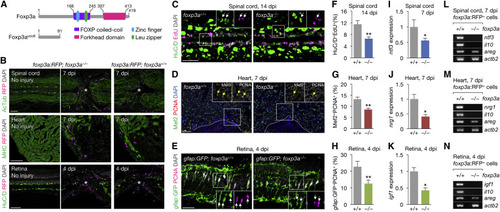
Impaired Regeneration in Foxp3a-Deficient Zebrafish (A) Foxp3a domain structure and predicted truncated product of the Foxp3avcc6 allele. Numbers indicate amino acid positions. (B) Sections of Foxp3a-deficient (foxp3a−/−) and WT (foxp3a+/+) clutch-mate foxp3a:RFP fish. Asterisks indicate injury epicenter. (C–E) Proliferation of newborn neurons (C), cardiomyocytes (D), and Müller glia (E). Insets show single-channel confocal slices (C and E) or epifluorescent images (D) of the demarcated regions. Arrows mark co-labeled cells. Dotted lines indicate the wound border. (F–H) Quantification of (C), (D) and (E), respectively (mean ± SEM, n = 5–7). (I–K) qRT-PCR analysis of regeneration factor genes (mean ± SEM, n = 6). (L–N) Semi-qRT-PCR analysis of regeneration factor genes in purified foxp3a:RFP+ cells. +/+, foxp3a+/+; −/−, foxp3a−/−. Confocal projections of z stacks are shown, except for the epifluorescent images in (D). ∗p < 0.05, ∗∗p < 0.01, Mann-Whitney U test. Scale bars, 50 μm. See also Figure S7. |
| Genes: | |
|---|---|
| Antibodies: | |
| Fish: | |
| Conditions: | |
| Anatomical Terms: | |
| Stage: | Adult |
Reprinted from Developmental Cell, 43, Hui, S.P., Sheng, D.Z., Sugimoto, K., Gonzalez-Rajal, A., Nakagawa, S., Hesselson, D., Kikuchi, K., Zebrafish Regulatory T Cells Mediate Organ-Specific Regenerative Programs, 659-672.e5, Copyright (2017) with permission from Elsevier. Full text @ Dev. Cell