
Fig. S2
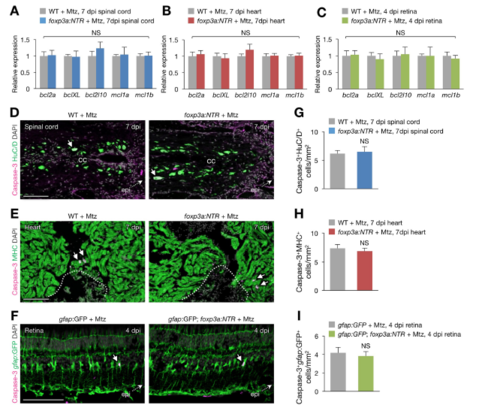
Survival gene expression and apoptosis in injured zTreg cell depleted tissues, Related to Figure 5. (A–C) qRT-PCR analysis of survival factors in injured spinal cords (A), hearts (B), and retinas (C) from control and zTreg cell-depleted fish (mean ± SEM, n = 6). (D–F) Immunofluorescence for activated Caspase-3. Arrows indicates apoptotic neurons (D; HuC/D+Caspase- 3+), cardiomyocytes (E; MHC+Caspase-3+), and Müller glia (F; gfap:GFP+Caspase-3+). Images show the rostral stump of a 7-dpi spinal cord. cc, central canal; epi, injury epicenter. Dotted line, wound border plane. (G–I) Quantification of D–F (mean ± SEM, n = 5). Mann–Whitney U test. NS, not significant. Scale bars, 100 μm. |
Reprinted from Developmental Cell, 43, Hui, S.P., Sheng, D.Z., Sugimoto, K., Gonzalez-Rajal, A., Nakagawa, S., Hesselson, D., Kikuchi, K., Zebrafish Regulatory T Cells Mediate Organ-Specific Regenerative Programs, 659-672.e5, Copyright (2017) with permission from Elsevier. Full text @ Dev. Cell