
Fig. S4
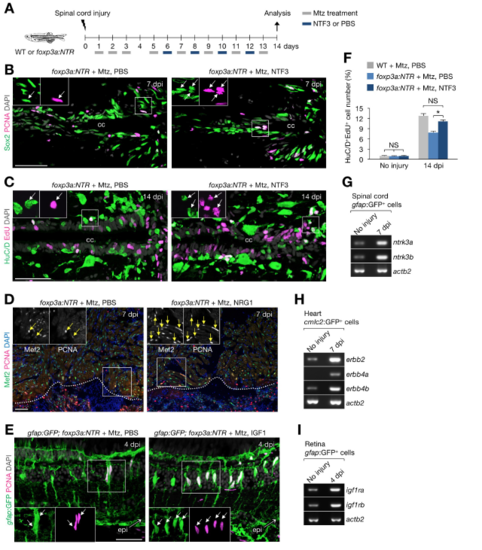
Regeneration factor administration and receptor gene expression in regenerating parenchymal cells, Related to Figure 6. (A) NTF3 treatment regimen. NTF3 or PBS was injected intraperitoneally (i.p.) from 6 dpi. (B–E) Proliferation of neural progenitor cells (B; Sox2+PCNA+), immature neurons (C; HuC/D+EdU+), cardiomyocytes (D; Mef2+PCNA+) and Müller glia (E; gfap:GFP+PCNA+). Insets show single-channel confocal slices (B, C, E) or epifluorescent images (D) of the demarcated regions. Dotted line, wound border plane. (F) Quantified proliferating immature neurons (HuC/D+EdU+) in C (mean ± SEM, n = 5). (G–I) Semi-qRT-PCR analysis of purified gfap:GFP+ cells from spinal cords (G; ependymo-radial glial cells), cmlc2:GFP+ cells from hearts (H; cardiomyocytes), and gfap:GFP+ cells from retinas (I; Müller glia). Confocal projections of z-stacks are shown, except for the epifluorescent images shown in D. *P < 0.05, **P < 0.01, Mann–Whitney U test. NS, not significant. Scale bars, 50 μm. |
Reprinted from Developmental Cell, 43, Hui, S.P., Sheng, D.Z., Sugimoto, K., Gonzalez-Rajal, A., Nakagawa, S., Hesselson, D., Kikuchi, K., Zebrafish Regulatory T Cells Mediate Organ-Specific Regenerative Programs, 659-672.e5, Copyright (2017) with permission from Elsevier. Full text @ Dev. Cell