
Fig. S7
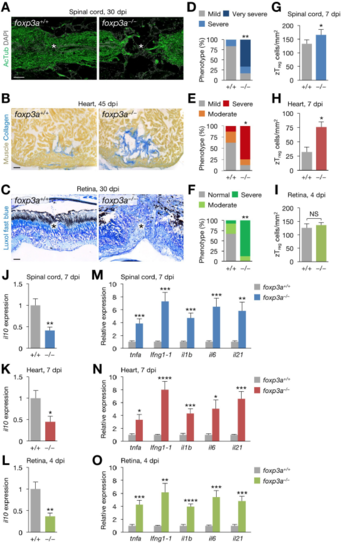
Regeneration phenotype of foxp3a–/– zebrafish, Related to Figure 7. (A) Sections of 30 dpi spinal cords from clutch mate WT (foxp3a+/+; left) and foxp3a–/– fish (right). Immunofluorescence for acetylated Tubulin (AcTub) marks nerves. Asterisks, injury epicenter. (B) Picro-Mallory staining of sections from 45 dpi hearts from WT (left) and foxp3a–/– fish (right). (C) Luxol fast blue staining of sections from 30 dpi retinas from WT (left) and foxp3a–/– fish (right). Asterisks, injury epicenter. (D–F) Quantification of regeneration in A–C (n = 6–8). (G–I) Quantification of zTreg cells in Figure 7B (mean ± SEM, n = 5). (J–L) il10 expression in injured spinal cords (J), hearts (K), and retinas (L) from WT and foxp3a–/– fish (mean ± SEM, n = 5). (M–O) The expression of inflammatory cytokine genes in injured spinal cords (M), hearts (N), and retinas (O) from WT and foxp3a–/– fish (mean ± SEM, n = 5). Gene expression is normalized to the levels in WT fish. *P < 0.05, **P < 0.01, ***P < 0.005, ****P < 0.0001, Fisher’s exact test (D–F), Mann–Whitney U test (G–O). Scale bars, 50 μm. |
| Fish: | |
|---|---|
| Conditions: | |
| Observed In: | |
| Stage: | Adult |
Reprinted from Developmental Cell, 43, Hui, S.P., Sheng, D.Z., Sugimoto, K., Gonzalez-Rajal, A., Nakagawa, S., Hesselson, D., Kikuchi, K., Zebrafish Regulatory T Cells Mediate Organ-Specific Regenerative Programs, 659-672.e5, Copyright (2017) with permission from Elsevier. Full text @ Dev. Cell