
Fig. 4
- ID
- ZDB-FIG-170825-6
- Publication
- Paksa et al., 2016 - Repulsive cues combined with physical barriers and cell-cell adhesion determine progenitor cell positioning during organogenesis
- Other Figures
- All Figure Page
- Back to All Figure Page
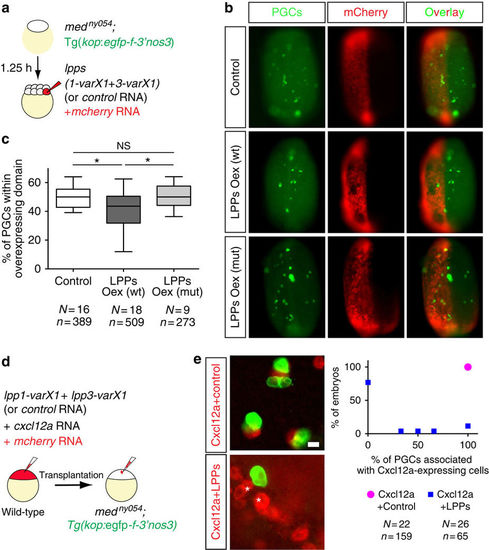
PGCs avoid regions expressing LPP proteins. (a) Generation of embryos lacking Cxcl12a, whose PGCs are labelled by EGFP and overexpress either LPP proteins or a Control protein in mCherry-labelled half of the embryo. (b) PGCs avoid cellular domains of the embryos, which overexpress LPPs (middle row), as compared to control domains (top row) or those overexpressing phosphatase-inactive versions of LPPs (lower row). (c) A significant reduction in the percentage of PGCs located within the LPPs-overexpressing domain in 10 hpf embryos (one-way analysis of variance; *P≤0.05). Error bars designate minimum to maximum range of the data points. N and n show the number of embryos and PGCs, respectively. See also Supplementary Fig. 8. (d) mCherry-labelled cells overexpressing Cxcl12a with either a Control Protein or LPPs were transplanted into embryos lacking Cxcl12a (medny054) whose PGCs express EGFP. (e) Images and a graph demonstrating the association of PGCs with Cxcl12a-expressing cells in control embryos (upper image, magenta point in graph) and the lack of interaction with cells expressing Cxcl12a and LPPs (starred red cells in lower image, blue points in graph, 77% of embryos showed absolutely no cell association). The statistical significance was evaluated using the Mann–Whitney U-test (****P≤0.0001). Scale bar, 15 μm. See also Supplementary Movie 3 and Supplementary Fig. 9. |