
Fig. S7
- ID
- ZDB-FIG-170825-14
- Publication
- Paksa et al., 2016 - Repulsive cues combined with physical barriers and cell-cell adhesion determine progenitor cell positioning during organogenesis
- Other Figures
- All Figure Page
- Back to All Figure Page
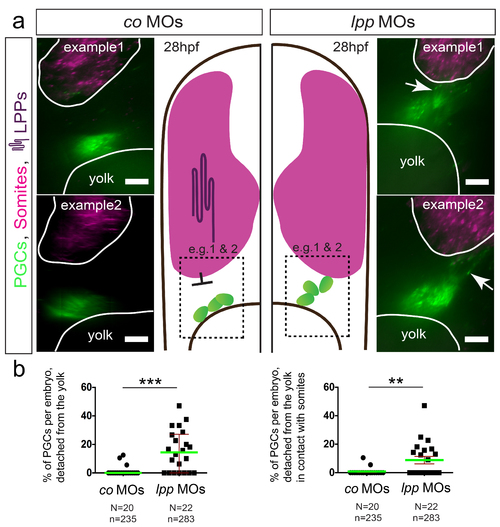
PGCs contact the somites in embryos treated with MOs against lpps (a) PGCs are labeled with EGFP (Tg(kop:egfp-f-3'nos3)) and egfp RNA, both shown in green, with the somites labeled using myoD (shown in magenta) employing the RNAscope procedure. PGCs contact the somites in LPP-knocked down embryos (right, examples 1 and 2), as compared with control embryos, in which PGCs are located at a distance from the somite border and in contact with the yolk (left, examples 1 and 2). (b) The percentage of PGCs per embryo that detached from the yolk (left) as well as those contacted the somites (right) in 28hpf embryos. Green lines represent the median and mean values and error bars indicate median with interquartile range and s.e.m. (left and right respectively). The statistical significance was evaluated using the Mann-Whitney U test (**p ≤ 0.01 and ***p ≤ 0.001). N is the number of embryos and n the number of PGCs examined. Scale bars signify 10μm. Dorsal is up. |