
Fig. 2
- ID
- ZDB-FIG-150616-2
- Publication
- Dalgin et al., 2015 - Differential levels of Neurod establish zebrafish endocrine pancreas cell fates
- Other Figures
- All Figure Page
- Back to All Figure Page
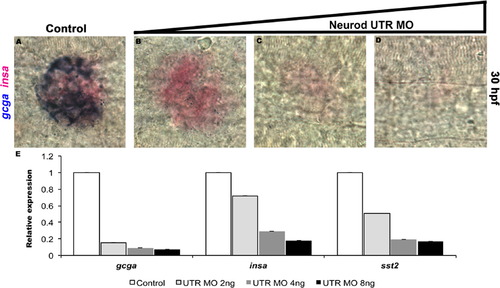
Quantitative analysis of Neurod morphant endocrine cell differentiation. Double in situ hybridization for glucagon (gcga, blue) and insulin (insa, red) at 30 hpf. Control (A), Neurod UTR MO 2 ng (B), 4 ng (C) or 8 ng (D) injected specimens. Results are representative of two independent experiments and from a minimum of 20 embryos per group. (E) Relative levels of gcga, insa and sst2 by real-time qPCR. Results are from 2 independent experiments and from 3 technical replicates and confirmed by two independent primer sets per gene of interest. All values were normalized to beta-actin levels. Primer sequences are listed in Table S1. |
Reprinted from Developmental Biology, 402(1), Dalgin, G., Prince, V.E., Differential levels of Neurod establish zebrafish endocrine pancreas cell fates, 81-97, Copyright (2015) with permission from Elsevier. Full text @ Dev. Biol.