
Fig. 10
- ID
- ZDB-FIG-150616-9
- Publication
- Dalgin et al., 2015 - Differential levels of Neurod establish zebrafish endocrine pancreas cell fates
- Other Figures
- All Figure Page
- Back to All Figure Page
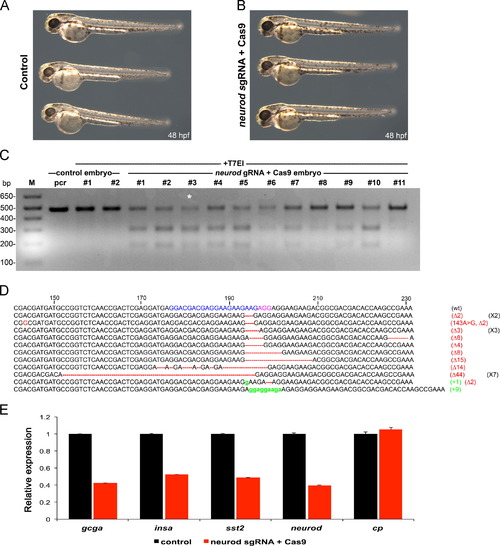
Neurod sgRNA/Cas9 mediated transient mutagenesis phenocopies the endocrine cell defects found in Neurod morphants. (A) Control and (B) neurod sgRNA/Cas9 injected specimens at 48 hpf. No gross morphological defects were observed. (C) T7 endonuclease I assay (T7EI) assay. (Lane 1) marker, (lane 2) untreated and (lane 3, 4) T7EI treated amplicons from control embryos. (Lane 5–15) Amplicons from embryos injected with neurod sgRNA/Cas9 were digested in varying ratios by T7EI enzyme. Asterisks indicate the PCR product that was TOPO cloned and sequenced. (D) The sequence alignment of wild type (wt), insertion (18/20, red) and deletion (2/20, green) mutations recovered from sequenced clones. Neurod sgRNA genomic target sequence (blue), protospacer adjacent motif-PAM sequence (pink). (E) Relative levels of gcga, insa, sst2, neurod and cp by real-time qPCR. Results are from 3 independent experiments and from 2 technical replicas. All values were normalized to beta-actin levels. Primer sequences are listed in Table S1. |
Reprinted from Developmental Biology, 402(1), Dalgin, G., Prince, V.E., Differential levels of Neurod establish zebrafish endocrine pancreas cell fates, 81-97, Copyright (2015) with permission from Elsevier. Full text @ Dev. Biol.