
Fig. 6
- ID
- ZDB-FIG-150616-6
- Publication
- Dalgin et al., 2015 - Differential levels of Neurod establish zebrafish endocrine pancreas cell fates
- Other Figures
- All Figure Page
- Back to All Figure Page
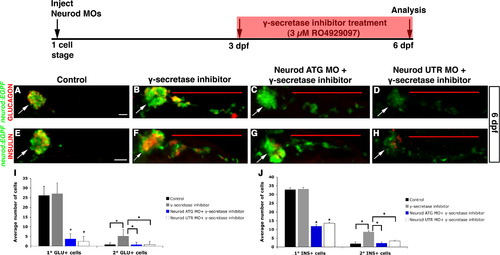
IPD-derived secondary endocrine cells, formed in response to inhibition of Notch signaling, are sensitive to Neurod knockdown. Experimental schedule (top); Tg(neurod:EGFP) control and Neurod morphant larvae were treated with 3 µM RO4929097 (γ-secretase inhibitor) from 3 to 6 dpf. Confocal images (merged z-stacks) of representative 6 dpf Tg(neurod:EGFP) untreated specimen (A, E), γ-secretase inhibitor treated specimen (B, F), γ-Secretase inhibitor treated Neurod ATG morphant [1 ng] (C, G) and γ-secretase inhibitor treated Neurod UTR morphant [2 ng] (D, H). Whole mount immunolabeling for GFP (green) and glucagon (red) (A–D) or for GFP (green) and insulin (red) (E–H). Mean (±s.d.) number of cells expressing glucagon (I) or insulin (J) from 4 independent experiments and from a minimum of 40 and 25 larvae per group, respectively. *P<0.0001; t-test, two-tailed distribution. Primary endocrine islet (arrow), IPD-derived endocrine cells (red line). Magnification is different in panel A than in B–H. Scale bar=20 µm. |
Reprinted from Developmental Biology, 402(1), Dalgin, G., Prince, V.E., Differential levels of Neurod establish zebrafish endocrine pancreas cell fates, 81-97, Copyright (2015) with permission from Elsevier. Full text @ Dev. Biol.