
FIGURE
Fig. S8
- ID
- ZDB-FIG-150616-17
- Publication
- Dalgin et al., 2015 - Differential levels of Neurod establish zebrafish endocrine pancreas cell fates
- Other Figures
- All Figure Page
- Back to All Figure Page
Fig. S8
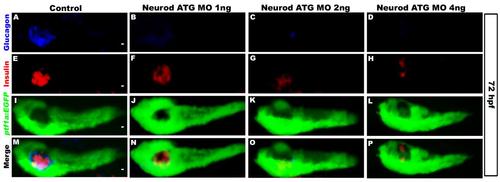
Neurod-deficient specimens have normal acinar cell development. Confocal images (merged z-stacks) of representative 72 hpf Tg(ptf1a:EGFP) embryos. Whole mount immunolabeling for glucagon (blue, A-D), insulin (red, E-H), GFP (green, I-L). Control (A, E, I, M), Neurod ATG MO 1 ng (B, F, J, N), 2 ng (C, G, K, O) or 4 ng (D, H, L, P) injected specimens. Merged images with all three colors are also shown (M-P). Results are representative of 2 independent experiments and from a minimum of 15 embryos per group. White scale bar=10 µm. |
Expression Data
Expression Detail
Antibody Labeling
Phenotype Data
Phenotype Detail
Acknowledgments
This image is the copyrighted work of the attributed author or publisher, and
ZFIN has permission only to display this image to its users.
Additional permissions should be obtained from the applicable author or publisher of the image.
Reprinted from Developmental Biology, 402(1), Dalgin, G., Prince, V.E., Differential levels of Neurod establish zebrafish endocrine pancreas cell fates, 81-97, Copyright (2015) with permission from Elsevier. Full text @ Dev. Biol.