
Fig. 3
- ID
- ZDB-FIG-150616-3
- Publication
- Dalgin et al., 2015 - Differential levels of Neurod establish zebrafish endocrine pancreas cell fates
- Other Figures
- All Figure Page
- Back to All Figure Page
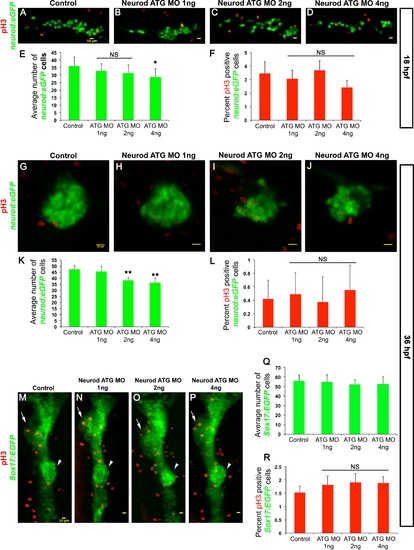
Neurod-deficient endocrine cells remain undifferentiated and have normal proliferation rate. Confocal images (merged z-stacks) of representative 18 hpf (A–D) and 36 hpf (G–H) Tg(neurod:EGFP) and 36 hpf Tg(sox17:EGFP) (M–P) embryos. Control (A, G, M), Neurod ATG MO 1 ng (B, H, N), 2 ng (C, I, O) or 4 ng (D, J, P) injected specimens. Whole mount immunolabeling for pH3 (red, A–D, G–J, M–P). Mean (±s.d.) number of cells expressing GFP (E, K, Q) and proliferation rate is shown as mean (± s.d.) percentage of cells expressing pH3 and GFP (F, L, R) from 2 independent experiments and from a minimum of 10 embryos per group. *P<0.013, **P<0.001; t-test, two-tailed distribution. NS, not significant. Embryos are oriented anterior to the left (A–D, G–J) and to the top (M–P). Arrows indicate liver and arrowheads indicate dorsal pancreas region. Yellow scale bar=10 µm. |
Reprinted from Developmental Biology, 402(1), Dalgin, G., Prince, V.E., Differential levels of Neurod establish zebrafish endocrine pancreas cell fates, 81-97, Copyright (2015) with permission from Elsevier. Full text @ Dev. Biol.