
|
Fig. 2
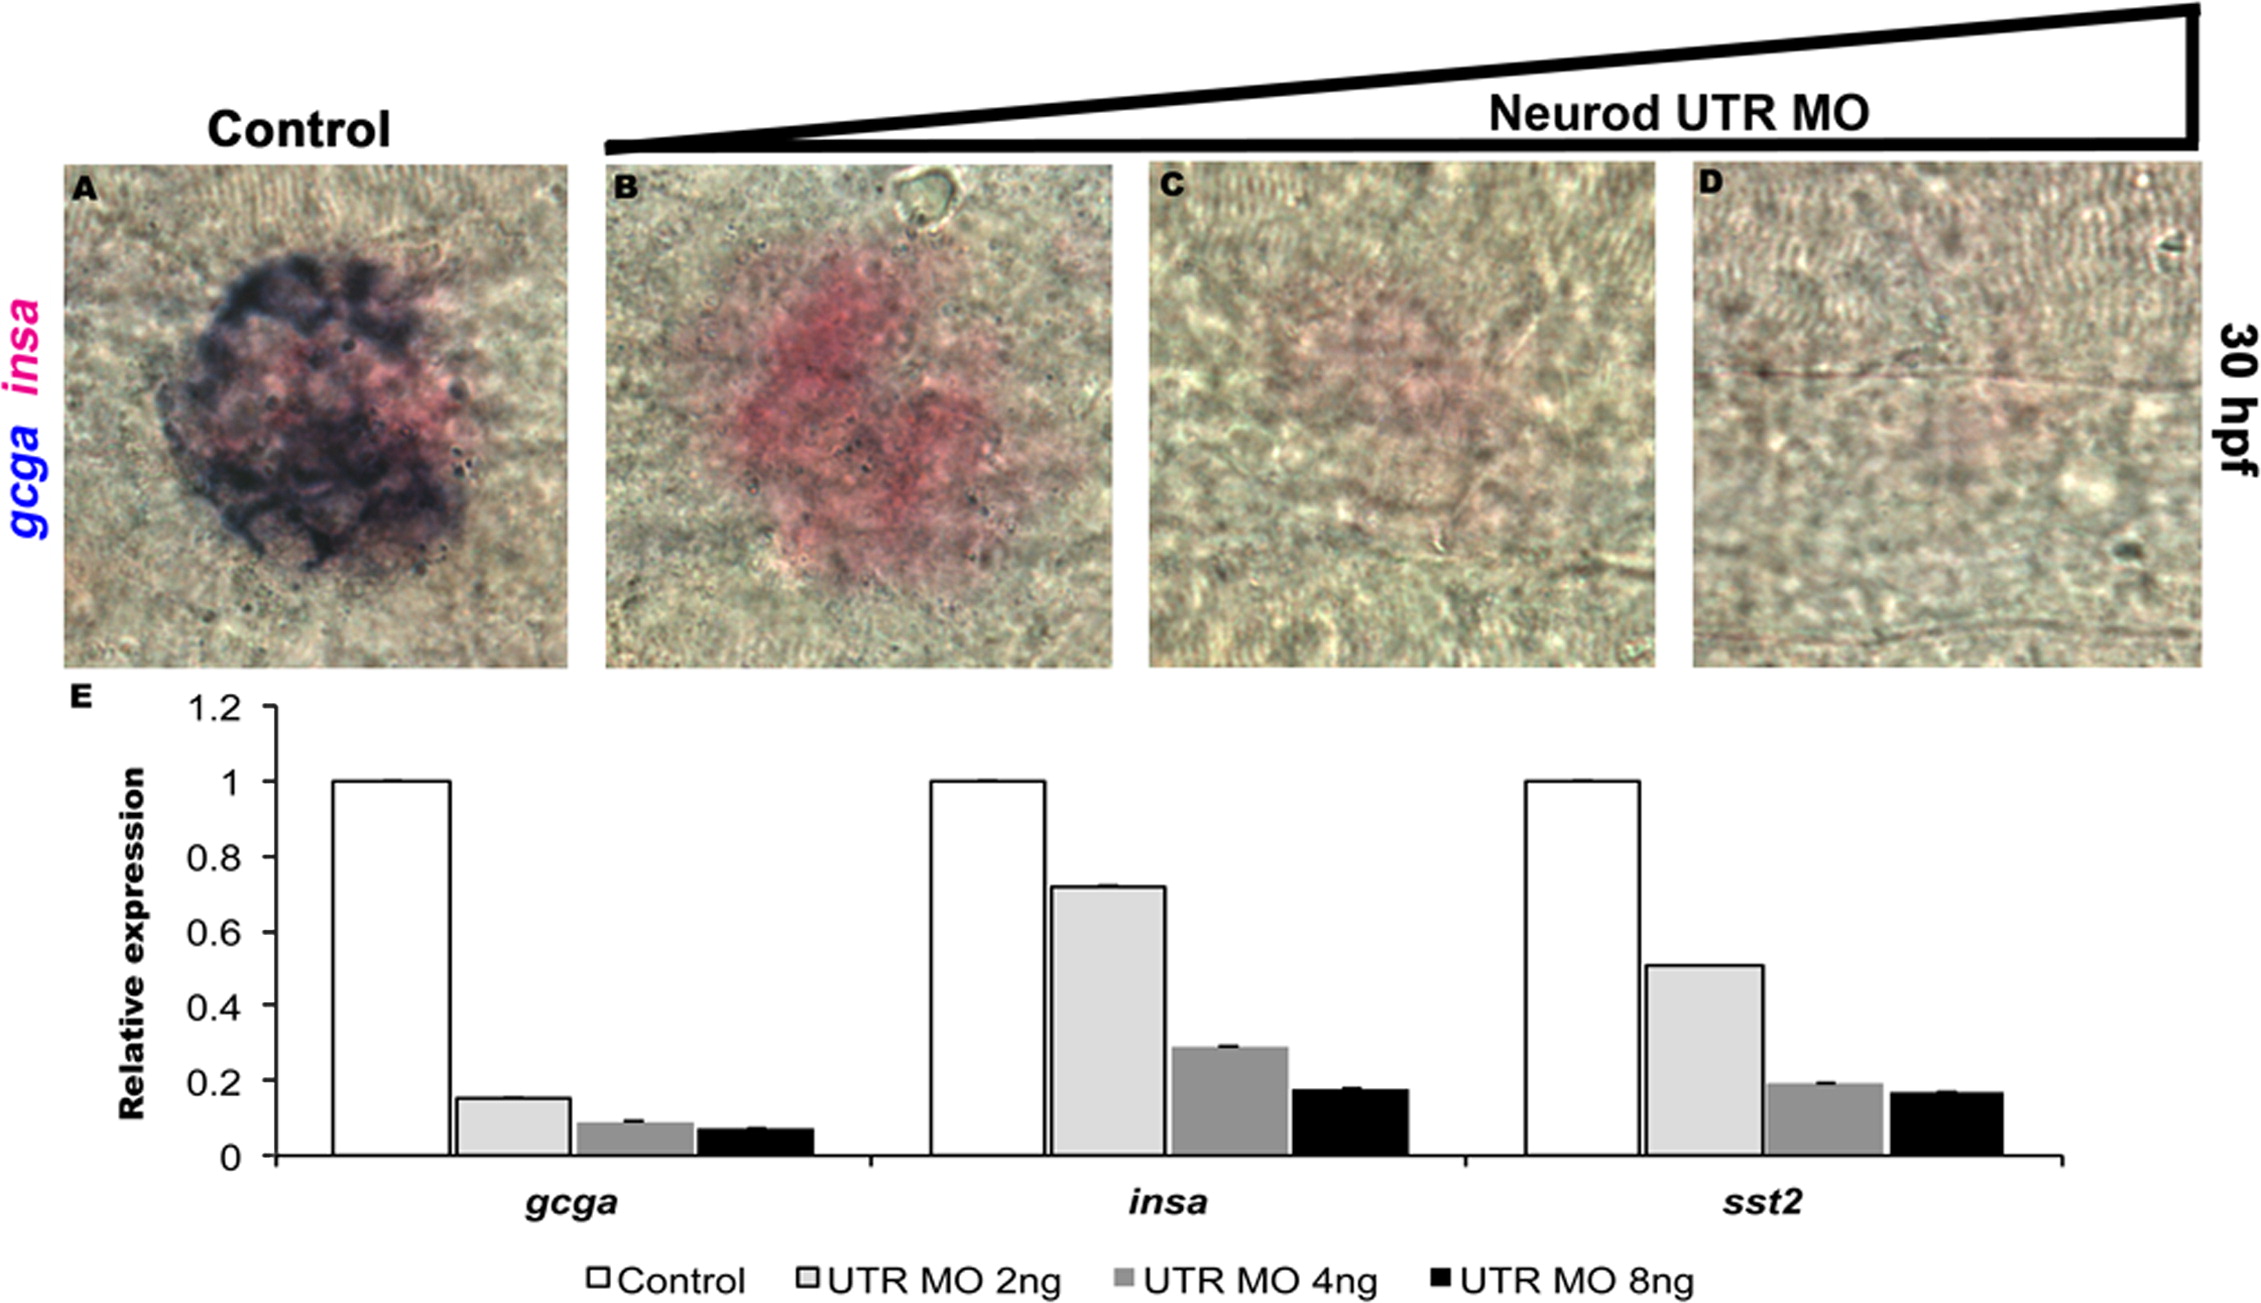
Quantitative analysis of Neurod morphant endocrine cell differentiation. Double in situ hybridization for glucagon (gcga, blue) and insulin (insa, red) at 30 hpf. Control (A), Neurod UTR MO 2 ng (B), 4 ng (C) or 8 ng (D) injected specimens. Results are representative of two independent experiments and from a minimum of 20 embryos per group. (E) Relative levels of gcga, insa and sst2 by real-time qPCR. Results are from 2 independent experiments and from 3 technical replicates and confirmed by two independent primer sets per gene of interest. All values were normalized to beta-actin levels. Primer sequences are listed in Table S1.
Reprinted from Developmental Biology, 402(1), Dalgin, G., Prince, V.E., Differential levels of Neurod establish zebrafish endocrine pancreas cell fates, 81-97, Copyright (2015) with permission from Elsevier. Full text @ Dev. Biol.