
Fig. 8
- ID
- ZDB-FIG-150316-10
- Publication
- Maier et al., 2014 - RA and FGF Signalling Are Required in the Zebrafish Otic Vesicle to Pattern and Maintain Ventral Otic Identities
- Other Figures
- All Figure Page
- Back to All Figure Page
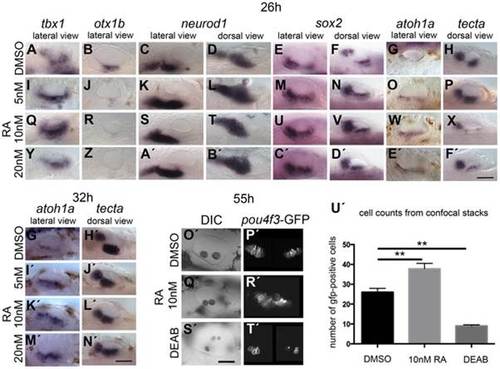
Effects of RA treatment on otic vesicle patterning. WT embryos were treated with DMSO or RA from 20S to 26 hpf (A–F′), 32 hpf (G′–N′) or 55 hpf (O2–T2). (A–H) WT embryos treated with DMSO show normal expression of non-neural markers tbx1 (n = 71; A) and otx1b (n = 52; B), the neuronal marker neurod1 (n = 50; C,D), and the sensory markers sox2 (n = 54), atoh1a (n = 63) and tecta (n = 40) (E–H). (I–X) Treatment with 5 nM RA (I–P) or 10 nM RA (Q–X) results in expanded tbx1 expression (n = 80/110; I,Q), down-regulation of otx1b expression (n = 104; J,R), and expansion of the neurod1 expression domain (n = 94/100). The expression of sox2 (n = 72/86) and atoh1a (n = 68) is extended in the ventral OV floor (M–O, U–W). Expression of tecta (n = 109) is reduced, but tecta-positive cells emerge in the inter-patch space (P,X). (Y–F′) Treatment with 20 nM RA results in a slight down-regulation, but anteroventral expansion, of tbx1 expression (n = 42/62; Y), down-regulation of otx1b expression (n = 64; Z), and an expansion of the neurod1 expression domain (n = 55; A′,B′). Expression of sox2 extends in the ventral OV floor (n = 51/62; C′,D′), while the expression of atoh1a (n = 38/40) is extended. Expression of tecta (n = 44/54) is down-regulated, but tecta-positive cells emerge in the inter-patch space (E′,F). (G′,H′) WT embryos treated with DMSO show normal expression of the sensory markers atoh1a (n = 34) and tecta (n = 49) when grown to 32 hpf. (I′–L′) In embryos treated with 5 nM (I′,J′), 10 nM (K′,L′) or 20 nM RA (M′–N′), expression of atoh1a extends in the ventral OV floor (n = 65, all concentrations). The expression of tecta (n = 96, all concentrations) indicates that the two sensory patches are closer together or fused (J′,L′,N′). (O′–U′) Tg(pou4f3:GFP) embryos treated with DMSO show normal hair cell development in two clearly separated sensory patches (n = 23; O′,P′). In Tg(pou4f3:GFP) embryos treated with 10 nM RA, GFP-positive cells differentiate between the anterior and posterior sensory patch in the ventral OV floor (n = 18; Q′,R′). In Tg(pou4f3:GFP) embryos treated with DEAB, GFP-positive cells are severely reduced in the OV (n = 13; S2,T2). (U′) Graphical representation of the number of GFP-positive cells per ear for each treatment. Error bars represent standard error of the mean. One-way ANOVA with Dunnett′s multiple comparison post-test: RA vs. DMSO: **p = 0.0082; DEAB vs. DMSO: **p = 0.0019. All panels are lateral views with anterior to the left, apart from the panels depicting tecta (dorsal views; anterior to the left). Scale bar: 50 µm. |
| Genes: | |
|---|---|
| Fish: | |
| Conditions: | |
| Anatomical Terms: | |
| Stage Range: | Prim-5 to Long-pec |
| Fish: | |
|---|---|
| Conditions: | |
| Observed In: | |
| Stage: | Long-pec |