
Fig. 10
- ID
- ZDB-FIG-150316-12
- Publication
- Maier et al., 2014 - RA and FGF Signalling Are Required in the Zebrafish Otic Vesicle to Pattern and Maintain Ventral Otic Identities
- Other Figures
- All Figure Page
- Back to All Figure Page
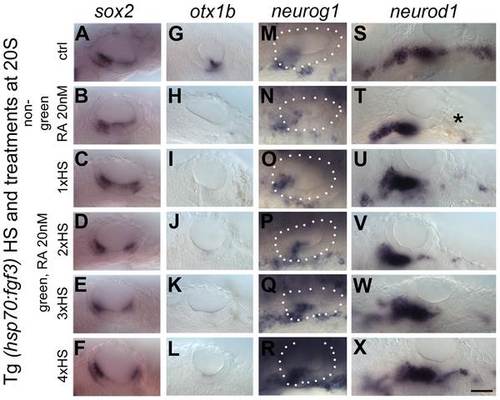
Elevated levels of FGF3 can counteract the effect of elevated RA signalling on sensory development. Tg(hsp70:fgf3) embryos were treated with DMSO (A,G,M,S) or 20 nM RA from 20S and the first heat shock applied at the same time. Embryos were heat shocked never (A,G,M,S), once (1×HS; C,I,O,U), twice (2×HS; D,J,P,V), three times (3×HS; E,K,Q,W) or four times (4×HS; F,L,R,X) and sorted as non-green non-transgenic siblings (B,H,N,T) or green transgenic embryos (C–X). Non-green non-transgenic siblings were pooled; different HS treatments did not affect the phenotype (B,H,N,T). (A,G,M,S) Tg(hsp70:fgf3) embryos treated with DMSO show normal expression of the sensory marker sox2 (A) and the non-neurogenic marker otx1b (G) and the otic markers neurog1 (M) and neurod1 (S). (B) In non-green sibling embryos treated with 20 nM RA, the expression of sox2 extends across the ventral OV floor. (C–F) In Tg(hsp70:fgf3) embryos treated with 20 nM RA and given 1×HS (C) or 2×HS (D), the expression of sox2 is present in two extended domains at the anterior and posterior of the OV. (E) In Tg(hsp70:fgf3) embryos treated with 20 nM RA and 3×HS the expression of sox2 is normal or slightly reduced. (F) In Tg(hsp70:fgf3) embryos treated with 20 nM RA and 4×HS the expression of sox2 is slightly reduced or normal; the posterior domain of expression is shifted laterally. (H) In non-green sibling embryos treated with 20 nM RA, the expression of otx1b is reduced. (I–L) In Tg(hsp70:fgf3) embryos treated with 20 nM RA and given 1×HS (I), 2×HS (J), 3×HS (K) or 4×HS (L), the expression of otx1b is greatly reduced. (N) In non-green sibling embryos treated with 20 nM RA, the expression of neurog1 is reduced in the OV. (O,P) In Tg(hsp70:fgf3) embryos treated with 20 nM RA and given 1×HS (O) or 2×HS (P), the expression of neurog1 is reduced in the OV. (Q) In Tg(hsp70:fgf3) embryos treated with 20 nM RA and 3×HS the expression of neurog1 is normal but slightly shifted towards posterior. (R) In Tg(hsp70:fgf3) embryos treated with 20 nM RA and 4×HS the expression of neurog1 is increased but shifted to a more posterior position in the floor of the OV. (S,T) In non-green sibling embryos treated with 20 nM RA, the expression of otic neurod1 is slightly increased, while expression is lost in prospective posterior lateral line and vagal ganglion cells posterior to the OV (asterisk). (U–W) In Tg(hsp70:fgf3) embryos treated with 20 nM RA and given 1×HS (U), 2×HS (V) or 3×HS (W) the expression of neurod1 is increased in the OV. In embryos heatshocked three times neuroblasts emerge in a more posterior position in the OV floor (W). (X) In Tg(hsp70:fgf3) embryos treated with 20 nM RA and 4×HS the expression of neurod1 is increased and otic neuroblasts emerge from a more posterior position in the floor of the OV. In addition, neurod1-positive cell populations re-emerge below the OV. All panels are lateral views with anterior to the left. For numbers see Table 1. Scale bar: 50 µm. |
| Genes: | |
|---|---|
| Fish: | |
| Condition: | |
| Anatomical Terms: | |
| Stage: | Prim-5 |