
Fig. S6
- ID
- ZDB-FIG-150316-18
- Publication
- Maier et al., 2014 - RA and FGF Signalling Are Required in the Zebrafish Otic Vesicle to Pattern and Maintain Ventral Otic Identities
- Other Figures
- All Figure Page
- Back to All Figure Page
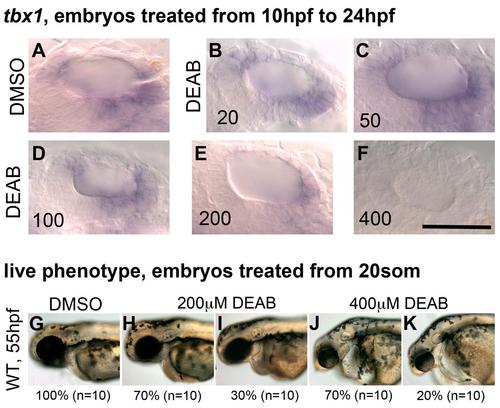
Titration of the RA inhibitor DEAB. Note: this experiment repeats published data [2] where DEAB treatment from 10 hpf to 24 hpf resulted in a complete loss of otic tbx1 expression. (A–F) Embryos were treated from 10 hpf to 24 hpf with DMSO (A) or varying concentrations of DEAB (B–F) and stained for tbx1 at 24 hpf. (A) DMSO-treated embryos display a normal pattern of tbx1 expression (n = 10). (B–D) No change in tbx1 expression is detected in embryos treated with 20 µM (B, n = 62), 50 µM (C, n = 35) or 100 µM (D, n = 11) DEAB. (E) Expression of tbx1 is down-regulated but not completely blocked in embryos treated with 200 µM DEAB (n = 13). (F) tbx1 expression is blocked altogether in embryos treated with 400 µM DEAB (n = 14). (G–K) WT embryos treated with DMSO (G) or DEAB (H–K) at 18/20S, washed at 26 hpf and grown on to 55 hpf. (G) WT embryos treated with DMSO develop normally. (H,I) In WT embryos treated with 200 µM DEAB, ear development is fairly normal (H) or slightly perturbed (I). (J,K) In WT embryos treated with 400 µM DEAB, ear development is severely perturbed in most cases (90%; n = 9/10). The head is also reduced in size and embryos display pericardial oedema. All panels are lateral views with anterior to the left. Scale bar: 50 µm. |