
Fig. 3
- ID
- ZDB-FIG-100723-19
- Publication
- Iida et al., 2010 - Metalloprotease-dependent onset of blood circulation in zebrafish
- Other Figures
- All Figure Page
- Back to All Figure Page
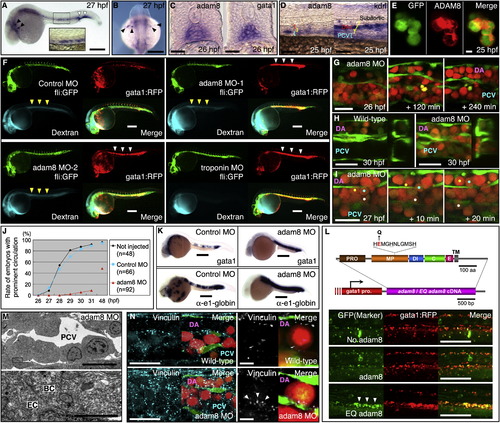
ADAM8 Is Essential for the Release of Primitive Blood into Circulation (A–D) ADAM8 is expressed in hematopoietic tissues. (A and B) The whole-mount in situ hybridization signal for adam8 mRNA is high in the subaortic region (also shown in the enlarged panel in A) of the intermediate cell mass, the posterior blood island (white arrowheads), and macrophages within the yolk (black arrowheads). Scale bars represent 250 μm. (C) Transverse sections of embryos at 26 hpf indicate coexpression of adam8 and gata1 in clustered blood cells in the subaortic region. Scale bars represent 25 μm. (D) adam8 mRNA is high in the subaortic region, but not in endothelial cells expressing kdrl. Scale bars represent 25 μm. (E) Membrane localization of zebrafish ADAM8 (zADAM8) protein. zADAM8-mCherry fusion protein was expressed in blood precursors under the control of a gata1 promoter. Scale bar represents 5 μm. (F–I) Depletion of ADAM8 causes blood congestion. (F and G) Representative images of live Tg(fli1a:eGFP)y1 Tg(gata1:mRFP)ko5 embryos injected with control oligo MO, antisense adam8 MO-1, antisense adam8 MO-2, or antisense troponin t2 MO observed by stereomicroscopy at 30 hpf (F) or by confocal microscopy at 26–30 hpf (G). In (F), accumulation of gata1:mRFP+ cells in the trunk is evident both in adam8 and troponin t2 morphants (white arrowheads). Dye-labeled dextran injected into the heart at 29 hpf enters into the circulation efficiently in the adam8 morphants (yellow arrowheads), but not in the troponin t2 morphant. In the adam8 MO-1 morphant, the intensity of fluorescent dextran is weak because blood cells that fully occupy the inside of the vessels restrict space for the dye. Scale bars represent 250 μm. (H) Representative Z stack images of embryos at 30 hpf. Intravascular blood accumulation is apparent in the adam8 morphant. Scale bars represent 25 μm. (I) Erythroid cells of the adam8 morphant invade actively from the subaortic region into the vasculature (marked with colored dots). Scale bar represents 25 μm. (J) The ratio of embryos that initiate blood circulation increases between 27 and 29 hpf in wild-type (black line) and control-oligo-injected (blue line) embryos, but not in adam8 morphants (red line). (K) In adam8 morphants, erythrocytes expressing gata1 and α-e1-globin accumulate in the trunk vessels abnormally at 30 hpf. Scale bars represent 250 μm. (L) Top: the active and inactive (EQ mutant) forms of ADAM8 were expressed under the control of a gata1 promoter together with GFP. Bottom: GFP-positive erythroid cells stagnate in the vasculature in the presence of inactive ADAM8. Scale bars represent 250 μm. (M) Representative electron micrographs of transversely sectioned adam8 morphants at 27 hpf. Erythroid cells adhere to the endothelial cells in the lumen of the PCV. Scale bars represent 10 μm (upper panel) and 1 μm (lower panel). (N) Vinculin is highly expressed at the interface between erythroid cells and endothelial cells and on the surface of erythroid cells in adam8 morphants at 27 hpf. Scale bars represent 25 μm (left) and 5 μm (right). |
| Genes: | |
|---|---|
| Antibody: | |
| Fish: | |
| Knockdown Reagents: | |
| Anatomical Terms: | |
| Stage Range: | Prim-5 to Prim-25 |
| Fish: | |
|---|---|
| Knockdown Reagents: | |
| Observed In: | |
| Stage: | Prim-15 |