
Fig. 1
- ID
- ZDB-FIG-100723-17
- Publication
- Iida et al., 2010 - Metalloprotease-dependent onset of blood circulation in zebrafish
- Other Figures
- All Figure Page
- Back to All Figure Page
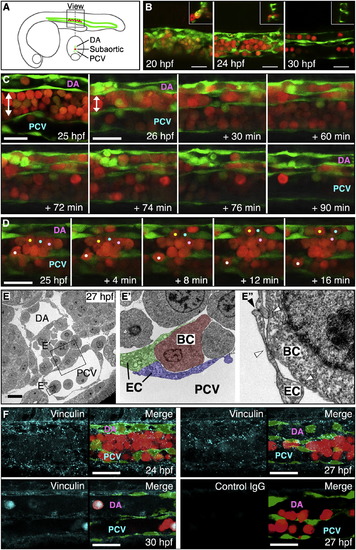
Onset of Primitive Blood Circulation Occurs Synchronously (A) Blood circulation was monitored in live Tg(fli1a:eGFP)y1 Tg(gata1:mRFP)ko5 embryos. The region of imaging is indicated. (B) Confocal images of gata1:mRFP+ erythrocytes before (20 and 24 hours postfertilization [hpf]) and after the onset of circulation (30 hpf). Note that few erythrocytes are found in the luminal phase of the dorsal aorta (DA) at 24 hpf. Scale bars represent 25 μm. (C) Time-lapse imaging capturing the initiation of blood circulation. Representative live-imaging stills from a key moment when primitive blood starts to flow in an embryo are shown. Once vessel formation has proceeded significantly at around 26 hpf (0 min), gata1:mRFP+ cells in the subaortic region (double-headed white arrow) become prominently motile and begin invasion into the DA and posterior cardinal vein (PCV) one after another. The sequential blood invasion into the DA (72 min) is followed by the sudden onset of circulation in the DA (74 min). Finally, the vast majority of RFP+ cells in the vasculature start to flow all at once (76 min). Scale bars represent 25 μm. (D) Invasion of gata1:mRFP+ cells (colored dots) into the vasculature. Scale bar represents 25 μm. (E–E″) Representative electron micrographs of transversely sectioned embryos at 27 hpf. Erythroid cells in the subaortic region, in the PCV, and during invasion through the endothelial cell layer are shown. Scale bar represents 10 μm. (E) Electron micrograph of a transversely sectioned embryo showing the aorta, the cardinal vein, and the subaortic region between them. Black boxes indicate areas shown enlarged in (E′) and (E″). (E′) Enlargement of (E) showing an invading erythroid cell (BC, blood cell) firmly surrounded by endothelial cells (EC). (E″) Enlargement of (E) showing erythroid cell tethered on the lumen of the PCV. White arrowheads indicate blood-vessel contact; black arrowheads indicate vessel-vessel contact. (F) Confocal images of embryos immunostained with anti-vinculin antibody (cyan) showing vinculin expression at the interface between erythroid and endothelial cells as well as among endothelial cells (24 hpf), followed by a gradual decrease (27 hpf). The vinculin signal disappears at the blood-vessel interface after the onset of blood circulation while remaining intracellularly in some erythroid cells (30 hpf). Scale bars represent 25 μm. |
| Genes: | |
|---|---|
| Antibody: | |
| Fish: | |
| Anatomical Terms: | |
| Stage Range: | 20-25 somites to Prim-15 |