
Fig. S2
- ID
- ZDB-FIG-100723-22
- Publication
- Iida et al., 2010 - Metalloprotease-dependent onset of blood circulation in zebrafish
- Other Figures
- All Figure Page
- Back to All Figure Page
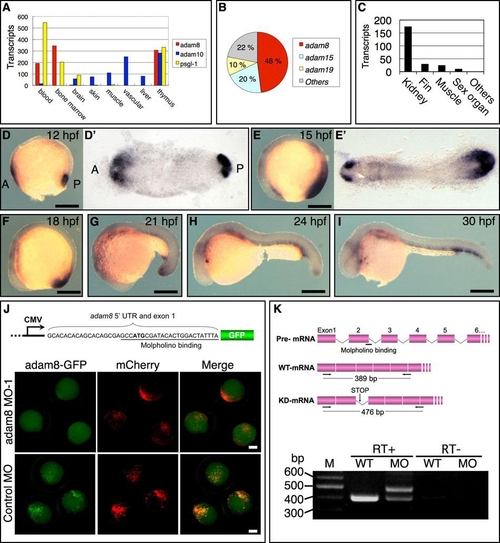
Expression and Knockdown Analyses of adam8 This figure relates to Figure 3. (A) Analysis of EST data from “Breakdown by Body Sites” in human. Bars indicate numbers of ESTs for adam8 (red) per million ESTs in individual tissues and those for adam10 (blue) and psgl-1 (yellow) as a comparison. adam8 and psgl-1 are highly expressed in hematopoietic tissues. In contrast, the expression of adam10 is extremely low in blood and bone marrow. (B) The ratio of ESTs of adam8, adam15, and adam19 to all adam ESTs found in human blood was calculated. (C) Analysis of EST data from “Breakdown by Body Sites” in zebrafish. Bars indicate numbers of ESTs for adam8 per million ESTs in individual tissues. The adam8 gene is highly expressed in kidney, the main hematopoietic tissue of adult fish. (D-I) WISH signal for adam8 mRNA at 12, 15, 18, 21, 24, and 30 hpf. D′ and E′ are dorsal views, and the remaining panels are lateral views. Scale bar represents 250 μm. (J and K) Injection of adam8-MO1 and adam8-MO2 knocked down translation of mRNA encoding GFP-tagged ADAM8 and inhibited splicing of adam8 intron-2, respectively. Scale bar represents 250 μm. In (K), total RNA extracted from 24 hpf embryos. |