
- Title
-
Metalloprotease-dependent onset of blood circulation in zebrafish
- Authors
- Iida, A., Sakaguchi, K., Sato, K., Sakurai, H., Nishimura, D., Iwaki, A., Takeuchi, M., Kobayashi, M., Misaki, K., Yonemura, S., Kawahara, A., and Sehara-Fujisawa, A.
- Source
- Full text @ Curr. Biol.
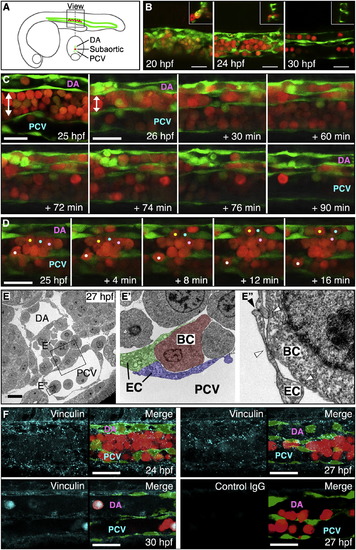
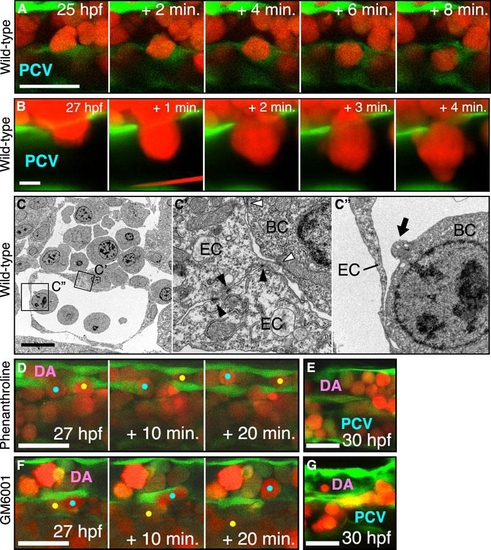
Onset of Primitive Blood Circulation Occurs Synchronously (A) Blood circulation was monitored in live Tg(fli1a:eGFP)y1 Tg(gata1:mRFP)ko5 embryos. The region of imaging is indicated. (B) Confocal images of gata1:mRFP+ erythrocytes before (20 and 24 hours postfertilization [hpf]) and after the onset of circulation (30 hpf). Note that few erythrocytes are found in the luminal phase of the dorsal aorta (DA) at 24 hpf. Scale bars represent 25 μm. (C) Time-lapse imaging capturing the initiation of blood circulation. Representative live-imaging stills from a key moment when primitive blood starts to flow in an embryo are shown. Once vessel formation has proceeded significantly at around 26 hpf (0 min), gata1:mRFP+ cells in the subaortic region (double-headed white arrow) become prominently motile and begin invasion into the DA and posterior cardinal vein (PCV) one after another. The sequential blood invasion into the DA (72 min) is followed by the sudden onset of circulation in the DA (74 min). Finally, the vast majority of RFP+ cells in the vasculature start to flow all at once (76 min). Scale bars represent 25 μm. (D) Invasion of gata1:mRFP+ cells (colored dots) into the vasculature. Scale bar represents 25 μm. (E–E″) Representative electron micrographs of transversely sectioned embryos at 27 hpf. Erythroid cells in the subaortic region, in the PCV, and during invasion through the endothelial cell layer are shown. Scale bar represents 10 μm. (E) Electron micrograph of a transversely sectioned embryo showing the aorta, the cardinal vein, and the subaortic region between them. Black boxes indicate areas shown enlarged in (E′) and (E″). (E′) Enlargement of (E) showing an invading erythroid cell (BC, blood cell) firmly surrounded by endothelial cells (EC). (E″) Enlargement of (E) showing erythroid cell tethered on the lumen of the PCV. White arrowheads indicate blood-vessel contact; black arrowheads indicate vessel-vessel contact. (F) Confocal images of embryos immunostained with anti-vinculin antibody (cyan) showing vinculin expression at the interface between erythroid and endothelial cells as well as among endothelial cells (24 hpf), followed by a gradual decrease (27 hpf). The vinculin signal disappears at the blood-vessel interface after the onset of blood circulation while remaining intracellularly in some erythroid cells (30 hpf). Scale bars represent 25 μm. EXPRESSION / LABELING:
|
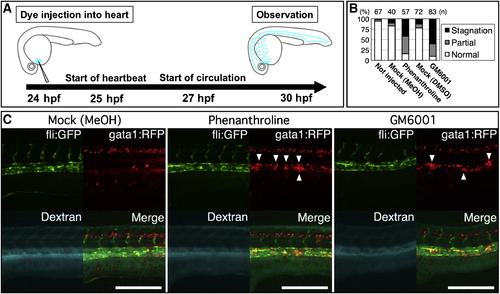
Injection of Metalloprotease Inhibitors into the Flow Disturbs the Onset of Blood Circulation (A) Protocol for monitoring effects of metalloprotease inhibitors (orthophenanthroline or GM6001) on blood circulation. These reagents were injected into the flow together with dye-labeled dextran (cyan) at 24 hpf. Blood circulation was observed at 30 hpf. (B and C) Effects of metalloprotease inhibitors and those of solvents (mock) on the onset of blood circulation were observed under a stereomicroscope. (B) Effects of metalloprotease inhibitors were evaluated by counting embryos showing complete blood stagnation (black bars) and those with partial stagnation (gray bars). (C) Abnormal accumulation of gata1:mRFP+ cells is indicated by white arrowheads. Note that metalloprotease inhibitor-injected embryos exhibit efficient flow of dye-labeled dextran (cyan). The effects of these inhibitors are transient, and blood circulation starts within a few hours, suggesting recovery of proteolytic activity. Scale bars represent 250 μm. |
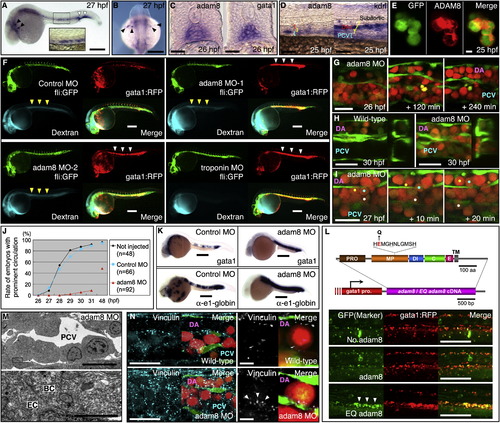
ADAM8 Is Essential for the Release of Primitive Blood into Circulation (A–D) ADAM8 is expressed in hematopoietic tissues. (A and B) The whole-mount in situ hybridization signal for adam8 mRNA is high in the subaortic region (also shown in the enlarged panel in A) of the intermediate cell mass, the posterior blood island (white arrowheads), and macrophages within the yolk (black arrowheads). Scale bars represent 250 μm. (C) Transverse sections of embryos at 26 hpf indicate coexpression of adam8 and gata1 in clustered blood cells in the subaortic region. Scale bars represent 25 μm. (D) adam8 mRNA is high in the subaortic region, but not in endothelial cells expressing kdrl. Scale bars represent 25 μm. (E) Membrane localization of zebrafish ADAM8 (zADAM8) protein. zADAM8-mCherry fusion protein was expressed in blood precursors under the control of a gata1 promoter. Scale bar represents 5 μm. (F–I) Depletion of ADAM8 causes blood congestion. (F and G) Representative images of live Tg(fli1a:eGFP)y1 Tg(gata1:mRFP)ko5 embryos injected with control oligo MO, antisense adam8 MO-1, antisense adam8 MO-2, or antisense troponin t2 MO observed by stereomicroscopy at 30 hpf (F) or by confocal microscopy at 26–30 hpf (G). In (F), accumulation of gata1:mRFP+ cells in the trunk is evident both in adam8 and troponin t2 morphants (white arrowheads). Dye-labeled dextran injected into the heart at 29 hpf enters into the circulation efficiently in the adam8 morphants (yellow arrowheads), but not in the troponin t2 morphant. In the adam8 MO-1 morphant, the intensity of fluorescent dextran is weak because blood cells that fully occupy the inside of the vessels restrict space for the dye. Scale bars represent 250 μm. (H) Representative Z stack images of embryos at 30 hpf. Intravascular blood accumulation is apparent in the adam8 morphant. Scale bars represent 25 μm. (I) Erythroid cells of the adam8 morphant invade actively from the subaortic region into the vasculature (marked with colored dots). Scale bar represents 25 μm. (J) The ratio of embryos that initiate blood circulation increases between 27 and 29 hpf in wild-type (black line) and control-oligo-injected (blue line) embryos, but not in adam8 morphants (red line). (K) In adam8 morphants, erythrocytes expressing gata1 and α-e1-globin accumulate in the trunk vessels abnormally at 30 hpf. Scale bars represent 250 μm. (L) Top: the active and inactive (EQ mutant) forms of ADAM8 were expressed under the control of a gata1 promoter together with GFP. Bottom: GFP-positive erythroid cells stagnate in the vasculature in the presence of inactive ADAM8. Scale bars represent 250 μm. (M) Representative electron micrographs of transversely sectioned adam8 morphants at 27 hpf. Erythroid cells adhere to the endothelial cells in the lumen of the PCV. Scale bars represent 10 μm (upper panel) and 1 μm (lower panel). (N) Vinculin is highly expressed at the interface between erythroid cells and endothelial cells and on the surface of erythroid cells in adam8 morphants at 27 hpf. Scale bars represent 25 μm (left) and 5 μm (right). |
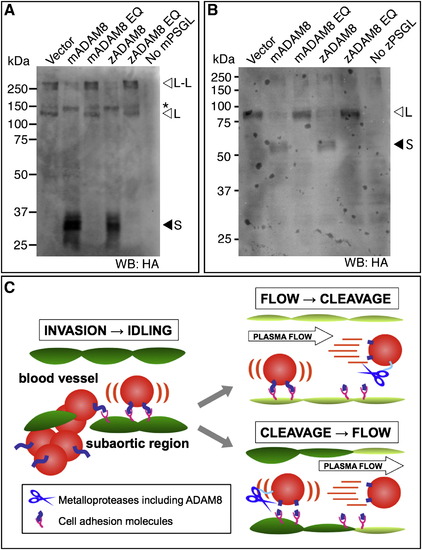
Onset of Blood Circulation Is Dependent on Metalloproteases and on the Flow (A and B) Mouse ADAM8 (mADAM8), mADAM8 EQ, zADAM8, zADAM8 EQ, or empty vector cDNA was coexpressed with mPSGL-1-HA (A) or zPSGL-1-HA (B) in HEK293T cells. Ectodomain shedding was assessed by western blotting for HA. Signals for long forms (L-L, dimer; L, monomer) were decreased and those for short forms (S) were increased significantly by expression of mADAM8 and zADAM8, but not by expression of EQ mutants. Dimeric forms cannot be found with zPSGL-1, probably because the N-terminal region missing in zPSGL-1 is required for the dimerization of mPSGL-1. Asterisks indicate intracellular forms. (C) A working hypothesis on the onset of primitive blood circulation. As a first step, erythroid cells adhere to the lumen of the vasculature after intravasation until the majority of blood cells transmigrate into the vasculature (“idling”). Next, these cells are released almost simultaneously through two conceivable pathways. In the first, ADAM8 activation in response to a threshold flow velocity or by some stimulus emanating from the vessel lumen causes detachment of erythroid cells and triggers the synchronous onset of blood circulation. In the second, ADAM8-dependent abrogation of erythroid cell adhesion (blue lines) to the blood vessels is a prerequisite, but not a direct trigger, for the synchronous onset of blood circulation. In this case, other stimuli would still be needed for release, such as a threshold flow or the removal of unknown molecules on the vasculature that prevent the release of blood cells. When the heartbeat starts, regurgitation of the flow occurs as a result of the heart valve immaturity. Thus, a unidirectional threshold flow would be generated by maturation of both the heart valve and the heart muscle. The threshold flow would then facilitate flattening and smoothing of blood vessel lumens and/or degradation of extracellular matrix proteins on the vessels that might loosely trap blood cells. Such an abrupt alteration in the vessel could be a direct trigger for the sudden and simultaneous onset of primitive blood circulation. |
Confocal Images of Erythroid Cells Invading into the Vasculature This figure relates to Figure 1 and 2. (A and B) Time-lapse imagings of their invasion into the PCV in a wild-type embryo. In (A), endothelial cells transiently encapsulate an erythroid cell invading into the PCV. Scale bar represents 25 μm. In (B), an erythroid cell adheres to the PCV with protrusions after invasion. Scale bar represents 5 μm. (C) An electron micrograph of showing adherence between the endothelial cells and between the erythroid and endothelial cells (C′) and a tiny membrane protrusion (black arrow in C″). Scale bar represents 10 μm. (D-G) Confocal images of live embryos injected with ortho-phenanthroline (D and E) or GM6001 (F and G) and showing normal invasion of gata1:mRFP+ cells (color dots) into the vasculature, but a dramatic accumulation inside the blood vessels in the trunk in those embryos. Scale bar represents 25 μm. |
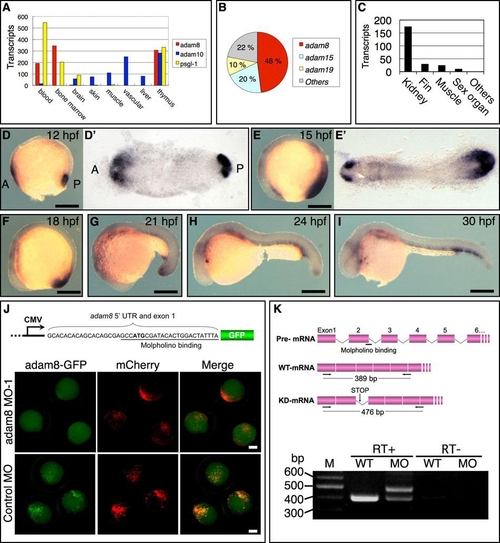
Expression and Knockdown Analyses of adam8 This figure relates to Figure 3. (A) Analysis of EST data from “Breakdown by Body Sites” in human. Bars indicate numbers of ESTs for adam8 (red) per million ESTs in individual tissues and those for adam10 (blue) and psgl-1 (yellow) as a comparison. adam8 and psgl-1 are highly expressed in hematopoietic tissues. In contrast, the expression of adam10 is extremely low in blood and bone marrow. (B) The ratio of ESTs of adam8, adam15, and adam19 to all adam ESTs found in human blood was calculated. (C) Analysis of EST data from “Breakdown by Body Sites” in zebrafish. Bars indicate numbers of ESTs for adam8 per million ESTs in individual tissues. The adam8 gene is highly expressed in kidney, the main hematopoietic tissue of adult fish. (D-I) WISH signal for adam8 mRNA at 12, 15, 18, 21, 24, and 30 hpf. D′ and E′ are dorsal views, and the remaining panels are lateral views. Scale bar represents 250 μm. (J and K) Injection of adam8-MO1 and adam8-MO2 knocked down translation of mRNA encoding GFP-tagged ADAM8 and inhibited splicing of adam8 intron-2, respectively. Scale bar represents 250 μm. In (K), total RNA extracted from 24 hpf embryos. |
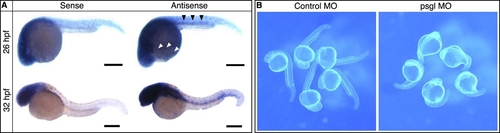
Expression and Knockdown Analyses of psgl-1 This figure relates to Figure 4. (A) WISH signal for psgl-1 mRNA, showing psgl-1 expressed in the trunk including the ICM region (black arrowheads) and macrophages (white arrowheads). (B) Knockdown analysis of psgl-1. The morphants exhibited serious developmental arrest at 24 hpf. Scale bar represents 250 μm. |