|
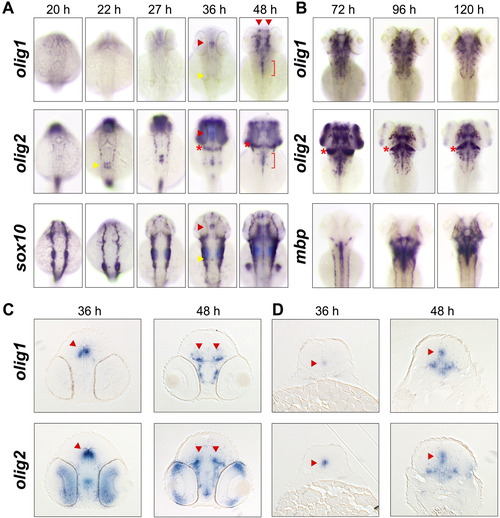
olig1 expression specifically marks differentiating oligodendrocytes. A: Onset of olig1 expression at 36 hpf in the brain was delayed compared to olig2 expression (from 22 hpf). Red arrowheads indicate midbrain oligodendrocytes characterized by olig1, olig2, and sox10 expression. Yellow arrowheads indicate earliest expression of olig1, olig2, and sox10 in hindbrain oligodendrocytes. Red brackets mark hindbrain expression of olig1 and olig2 at 48 hpf. Red asterisks indicate cerebellum expression of olig2. B: During late stages of embryogenesis, olig1- and olig2-expressing oligodendrocytes rapidly spread throughout the brain and accumulated in areas of mbp expression. C,D: Transverse sections of olig1 and olig2 in situ hybridizations at the level of the fore-midbrain (C) and hindbrain (D). Red arrowheads indicate co-expression domains of olig1 and olig2.
|