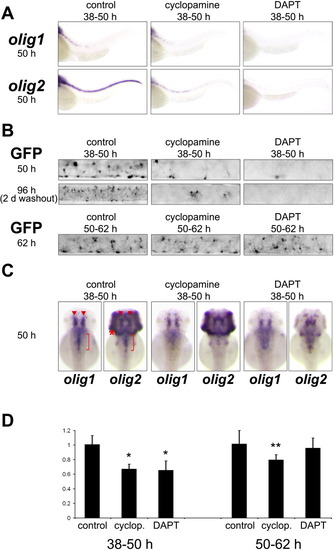
Maintenance of olig1 expression requires hedgehog but not notch signaling. A: Spinal cord expression of olig1 and olig2 was greatly reduced after 100 μM cyclopamine or DAPT treatment from 38-50 hpf. C: In contrast, expression in the brain was only mildly reduced by inhibition of hedgehog or notch signaling. While cyclopamine treatment reduced hindbrain oligodendrocyte expression of olig1 and olig2, DAPT had little effect although strongly reducing olig2 expression in the cerebellum (red asterisk) and the eye. Red arrowheads indicate midbrain oligodendrocytes and red bracket demarcates hindbrain oligodendrocytes. B: eGFP fluorescence in the spinal cord of olig1:mem-eGFP transgenics recapitulates olig1 expression after cyclopamine or DAPT treatment. Washout of inhibitors for 46 hr after treatment from 38-50 hpf did not rescue oligodendrocyte formation indicating an irreversible effect. Cyclopamine or DAPT treatment between 50-62 hpf showed no morphological difference in oligodendrocyte formation in the spinal cord. D: Quantitative RT-PCR analysis of olig1 expression in whole embryos. Results are internally controlled for ef1α expression. Data represent averages of 4 biological replicates with 2 technical replicates each (Student's t-test: *P < 0.002; **P < 0.03).
|
