
- Title
-
olig1 expression identifies developing oligodendrocytes in zebrafish and requires hedgehog and notch signaling
- Authors
- Schebesta, M., and Serluca, F.C.
- Source
- Full text @ Dev. Dyn.
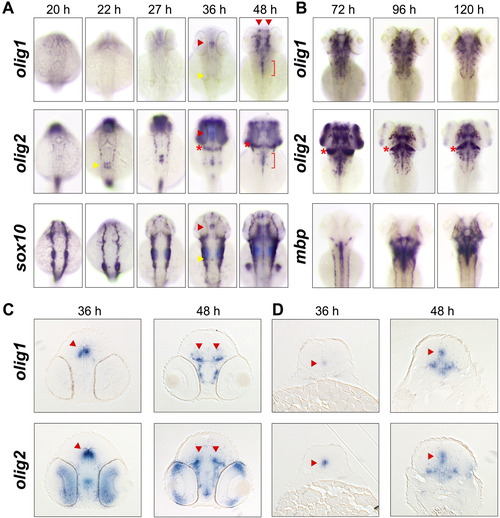
olig1 expression specifically marks differentiating oligodendrocytes. A: Onset of olig1 expression at 36 hpf in the brain was delayed compared to olig2 expression (from 22 hpf). Red arrowheads indicate midbrain oligodendrocytes characterized by olig1, olig2, and sox10 expression. Yellow arrowheads indicate earliest expression of olig1, olig2, and sox10 in hindbrain oligodendrocytes. Red brackets mark hindbrain expression of olig1 and olig2 at 48 hpf. Red asterisks indicate cerebellum expression of olig2. B: During late stages of embryogenesis, olig1- and olig2-expressing oligodendrocytes rapidly spread throughout the brain and accumulated in areas of mbp expression. C,D: Transverse sections of olig1 and olig2 in situ hybridizations at the level of the fore-midbrain (C) and hindbrain (D). Red arrowheads indicate co-expression domains of olig1 and olig2. EXPRESSION / LABELING:
|
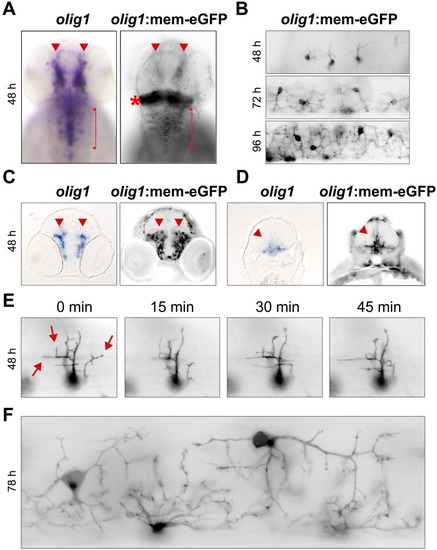
The olig1 promoter is sufficient to drive membrane-targeted eGFP expression in developing oligodendrocytes. A: eGFP expression from the 5.4-kb zebrafish olig1 promoter recapitulates endogenous olig1 expression determined by in situ hybridization. Red arrowheads indicate midbrain oligodendrocytes and red bracket demarcates hindbrain oligodendrocytes. Red asterisk marks ectopic expression of eGFP in the region of the cerebellum. B: Developmental time course demonstrates increasingly complex network of oligodendrocyte processes in the spinal cord of olig1:mem-eGFP transgenic animals at 48, 72, and 96 hpf. C,D: Transverse sections of olig1 in situ hybridizations and eGFP fluorescence at the level of the fore-midbrain (C) and hindbrain (D). Red arrowheads indicate olig1 expression domains. E: Time-lapse microscopy images of an individual oligodendrocyte in the 48-hpf spinal cord demonstrating its highly motile, extending, and retracting, membrane processes (red arrows). F: Close-up of eGFP+ oligodendrocytes in the spinal cord of a 78-hpf transgenic animal. |
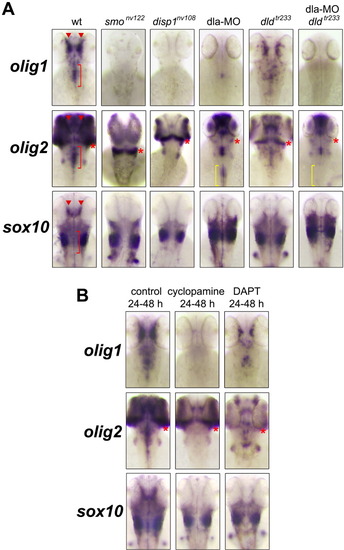
Initiation of olig1 expression depends on hedgehog and notch signaling. A: Hedgehog pathway mutants showed no olig1 expression at 48 hpf and greatly reduced olig2 expression in oligodendrocytes. Also sox10 expression in the brain of hedgehog mutants is absent. DeltaA knockdown animals had little olig1 expression at 52 hpf but still strong olig2 expression and deltaD mutant embryos (dldtr233) showed some reduction of olig1, olig2, and sox10 expression. Compound DeltaA knockdown/deltaD mutant embryos showed no olig1 expression at 52 hpf and greatly reduced olig2 expression in the anterior spinal cord (yellow bracket). B: 100 μM cyclopamine treatment from 24-48 hpf abolished olig1 and sox10 expression in oligodendrocytes and greatly reduced olig2 expression as compared to control treated animals. DAPT treatment (100 μM) from 24-48 hpf significantly reduced but did not abolish olig1, olig2, or sox10 expression. Red bracket marks location of hindbrain oligodendrocytes and red asterisks mark location of cerebellum. Red arrowheads indicate location of midbrain oligodendrocytes. EXPRESSION / LABELING:
|
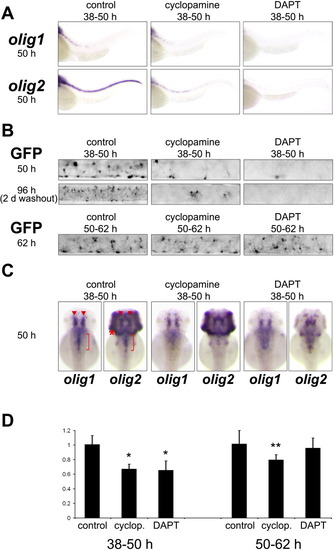
Maintenance of olig1 expression requires hedgehog but not notch signaling. A: Spinal cord expression of olig1 and olig2 was greatly reduced after 100 μM cyclopamine or DAPT treatment from 38-50 hpf. C: In contrast, expression in the brain was only mildly reduced by inhibition of hedgehog or notch signaling. While cyclopamine treatment reduced hindbrain oligodendrocyte expression of olig1 and olig2, DAPT had little effect although strongly reducing olig2 expression in the cerebellum (red asterisk) and the eye. Red arrowheads indicate midbrain oligodendrocytes and red bracket demarcates hindbrain oligodendrocytes. B: eGFP fluorescence in the spinal cord of olig1:mem-eGFP transgenics recapitulates olig1 expression after cyclopamine or DAPT treatment. Washout of inhibitors for 46 hr after treatment from 38-50 hpf did not rescue oligodendrocyte formation indicating an irreversible effect. Cyclopamine or DAPT treatment between 50-62 hpf showed no morphological difference in oligodendrocyte formation in the spinal cord. D: Quantitative RT-PCR analysis of olig1 expression in whole embryos. Results are internally controlled for ef1α expression. Data represent averages of 4 biological replicates with 2 technical replicates each (Student's t-test: *P < 0.002; **P < 0.03). |
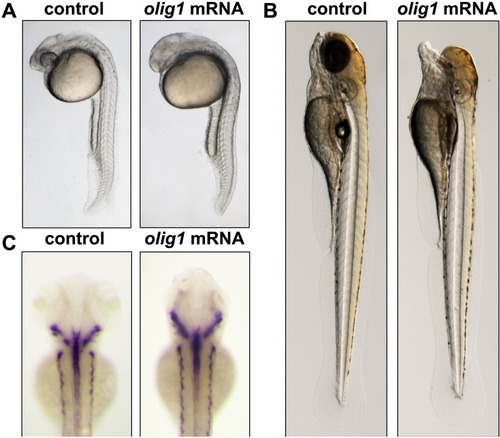
olig1 over-expression interferes with anterior head formation but does not affect mbp expression. Injection of 75 ng/μl olig1 mRNA resulted in truncation of anterior head structures at 24 hpf (A) and 72 hpf (B). In contrast, early mbp expression in the CNS at 72 hpf was not affected by olig1 over-expression (C). |
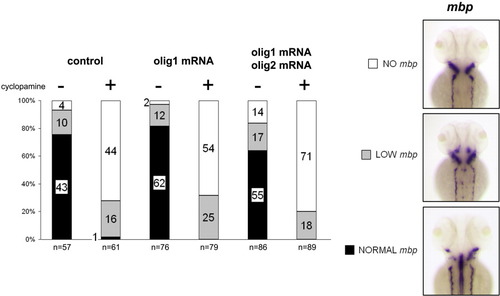
olig1 over-expression alone or together with olig2 does not rescue the lack of mbp+ oligodendrocytes caused by inhibition of hedgehog signaling. Embryos were either injected with 75 ng/μl olig1 mRNA alone or in combination with 150 ng/μl olig2 mRNA and treated with cyclopamine from 22 to 72 hpf. Numbers in columns indicate numbers of observed embryos while n indicates total number of analyzed embryo per treatment/injection. |
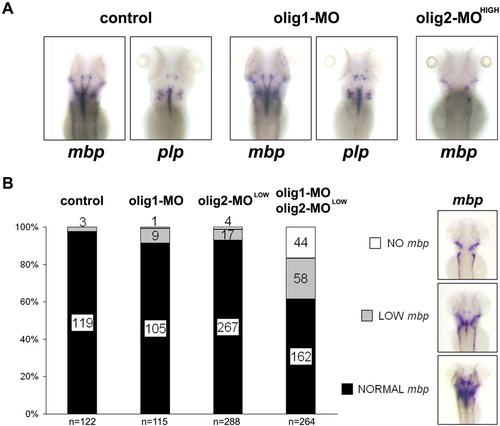
Olig1 knockdown alone does not interfere with oligodendrocyte development unless combined with an Olig2 sensitized background. A: Injection of 750 μM olig1 morpholino (olig-1-MO) alone had no effect on mpb or plp expression at 96 hpf while 250 μM olig2-MO abolished mbp expression in the CNS. B: In contrast, co-injection of 750 μM olig1-MO with low concentrations of olig2-MO (75 μM), each morpholino individually having no phenotype, reduced mbp+ oligodendrocytes. Numbers in columns indicate numbers of observed embryos while n indicates total number of analyzed embryo per treatment/injection. |
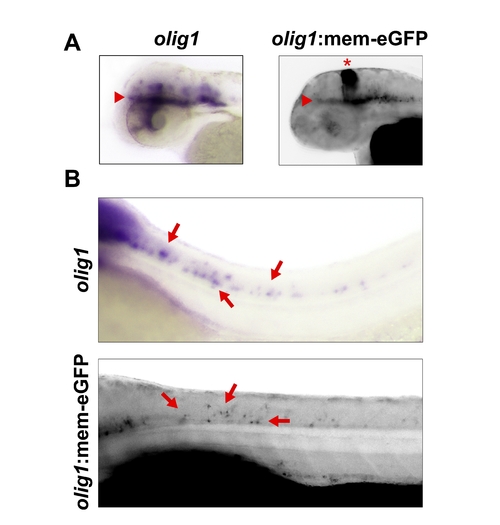
eGFP expression in olig1:mem-eGFP recapitulates endogenous olig1 expression determined by in situ hybridization. A: Side view comparison of brain expression at 48 hpf. Red arrowheads indicate midbrain oligodendrocytes and red asterisk marks ectopic expression of eGFP in the region of the cerebellum. B: Side view comparison of anterior spinal cord expression at 48 hpf. |

deltaD mutant embryos had fewer olig1-expressing oligodendrocytes at 52 hpf. Two independent examples for each genotype are shown. |

cyclopamine (100 μM) or DAPT (100 μM) treatment from 38-50 hpf, followed by a 46-hr washout, greatly reduced sox10 expression in the hindbrain (red arrowhead). |
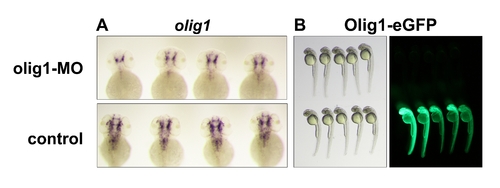
olig1 morpholino reduces olig1 expression and blocks translation of an Olig1-GFP fusion protein. A: Injection of 750 μM olig1 morpholino resulted in reduced mRNA expression of olig1 at 48 hpf compared to wildtype sibling controls. B: Translation of an injected reporter mRNA, containing the olig1-MO targeting sequence fused in frame to eGFP, was completely abolished by co-injection of olig1 morpholino at 250 μM or higher, while control-injected embryos without morpholino showed strong GFP activity. Several independent examples for each injection are shown for comparison. |
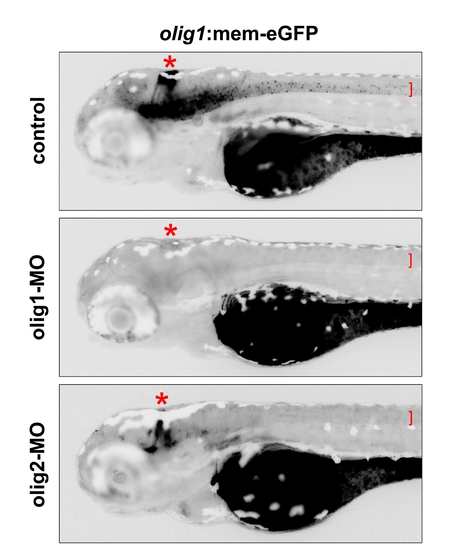
The olig1 morpholino blocks translation of eGFP in olig1:mem-eGFP transgenics while the olig2 morpholino interferes only with formation of eGFP+ oligodendrocytes. In uninjected control transgenic embryos (72 hpf), eGFP fluorescence is strongly observed in oligodendrocytes (red bracket) and in the cerebellum (red asterisks). In contrast, injection of 750 μM olig1-MO completely abolished translation of eGFP in transgenic embryos because the targeting sequence of olig1-MO is part of the transgenic construct. Injection of 250 μM olig2-MO blocks the development of oligodendrocytes, but does not block eGFP fluorescence in the cerebellum. |