
- Title
-
alyron, an insertional mutation affecting early neural crest development in zebrafish
- Authors
- Cretekos, C.J. and Grunwald, D.J.
- Source
- Full text @ Dev. Biol.

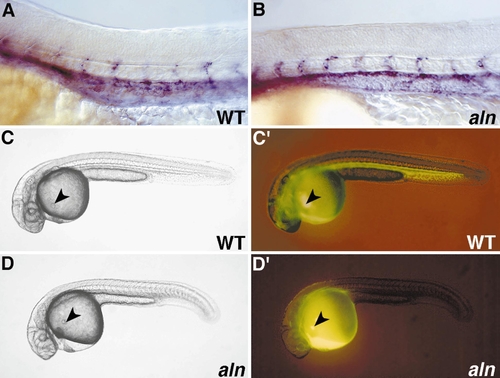
Overview of aln mutant phenotype. (A, B) WT sibling (A) and aln mutant (B) 24-h embryos. aln mutants display delayed pigmentation in the eye, a smaller than normal otic vesicle, and an enlarged pericardial cavity. In addition, mutant embryos are slightly delayed developmentally, having on average two less somites than their WT siblings at 24 h (not shown). (C, D) WT sibling (C) and aln mutant (D) 48-h embryos. aln mutants lack body pigmentation, do not circulate blood, and usually have reduced eye pigmentation. Differentiated blood cells accumulate above the yolk cell in mutants (arrowhead in D), whereas they are visible flowing into the inflow tract of the heart in WT embryos (arrowhead in C). (E, F) Expression of trp-2 in WT sibling (E) and aln mutant (F) 26-h embryos detected by RNA in situ hybridization. At 26 h, trp-2 expression is detectable in the retina but not elsewhere in aln mutants. (G, H) Xanthophores, identified by their bright blue autofluorescence under DAPI epifluorescence, are seen on the dorsal surface of the head of WT 48-h embryos (G), but are not detected in aln mutants (H). |
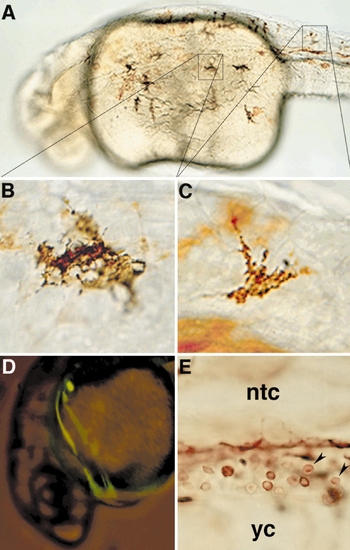
Genetic mosaic analysis. (A) Dorsolateral view of a WT → aln 26-h mosaic that displayed melanophores. The FITC–dextran lineage tracer, indicating WT donor cells, has been detected immunohistochemically (brown). (B, C) Higher magnification views of two of the melanophores pictured in A, showing that WT donor cells (brown) produce melanophores displaying normal morphology and pigmentation (black) in aln hosts. (D) Backlit FITC epifluorescence view of a living aln → WT 26-h mosaic. The mutant donor cells that differentiated as blood circulate normally, indicated by the green streaks generated by the passage of labeled cells through the circulatory system during a long exposure. (E) High-magnification view of the intermediate cell mass region of a WT → aln mosaic (anterior to the left, dorsal to the top). The FITC–dextran lineage tracer has been detected immunohistochemically. WT cells (brown) that display typical erythroid morphology (arrowheads) fail to circulate and instead accumulate between the yolk cell (yc) and the notochord (ntc). |
Analysis of cardiovascular defect. (A, B) WT sibling (A) and aln mutant (B) 24-h embryos stained for flk-1 expression by RNA in situ hybridization. The major blood vessels appear to be formed normally in mutant embryos. (C–D′) Fluid circulation was visualized by microinjection of fluorescent dye into the common cardinal vein. The site of dye injection in a 26-h WT sibling (C, C′) and aln mutant (D, D′) is indicated by arrowheads. (C′) Epifluorescence view of the WT embryo pictured in C, photographed about 1 min after injection. Dye has passed through the heart, circulated through the head, and traveled to and returned from the tail. (D′) Epifluorescence view of the aln mutant embryo pictured in D, photographed 30 min after injection. Dye was drawn into the heart, but little if any circulated further. |
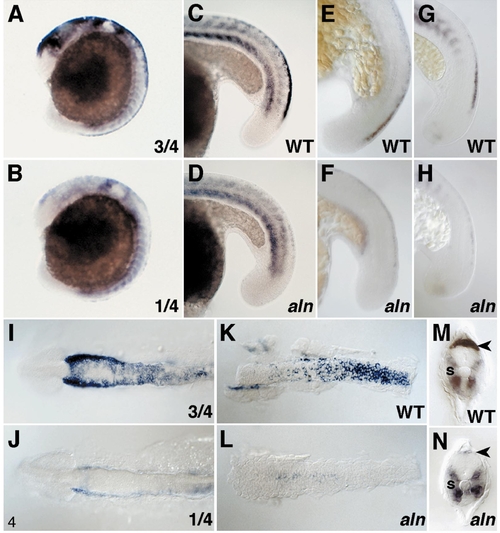
Analysis of premigratory neural crest development. (A, B) One-fourth of 16-h aln/+ intercross progeny display a marked reduction in the expression of snail-2 along the dorsal midline of the head and anterior trunk (B), compared to the remaining three-fourths (A). Expression of snail-2 in the developing trunk somites is similar in the two classes. (C–H) Expression of markers for premigratory neural crest in the trunk and tail of sibling WT (C, E, G) and aln mutant (D, F, H) 18-h embryos. Mutant embryos were identified by simultaneous staining for trp-2 expression, which is greatly reduced in the mutant retina. Mutant embryos display severely reduced expression of snail-2 (C, D), AP-2 (E, F), and fkd-6 (G, H) along the dorsal midline of the trunk and tail. (I, J) Dorsal views of the heads of 12-h aln/+ intercross progeny dissected from the yolk and mounted flat (anterior to the left). Expression of snail-2 in neural crest at the edges of the anterior neural keel is reduced in one-fourth of the embryos (J) compared to the remaining three-fourths (I). (K, L) Dorsal views of neural keels dissected from 20-h aln/+ intercross progeny doubly stained for trp-2 and snail-2 (anterior is to the left). Mutant embryos display dramatically reduced snail-2-expression. (M, N) Transverse sections through the nascent somite of 24-h aln/+ intercross progeny (dorsal to the top). Mutant embryos display reduced expression of snail-2 mRNA in the premigratory neural crest (arrowheads). Expression of snail-2 in the somites (s) appears normal in both expression pattern and level in mutants. EXPRESSION / LABELING:
PHENOTYPE:
|
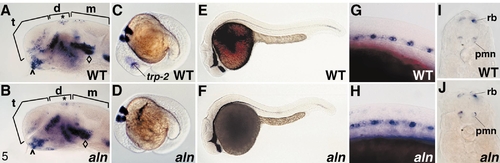
Analysis of rostrocaudal (A–D) and dorsoventral (E–J) patterning in the neuraxis. Prior to 24 h, aln mutant embryos were identified by simultaneous staining for trp-2 expression, which is greatly reduced in the mutant retina (C, D, G, H). Expression of zash-1A in WT sibling (A) and aln mutant (B) 24-h embryos. The major compartments of the brain are indicated by brackets: telencephalon (t), diencephalon (d), and mesencephalon (m). The hypothalamus (∧), epiphysis (*), and tegmentum (♦) are also indicated. (C, D) Expression of krox-20 in rhombomeres 3 and 5 of the hindbrain in WT sibling (C) and aln mutant (D) 18.5-h embryos, double stained with trp-2 (indicated in C). (E, F) Expression of sonic hedgehog in the ventral brain and floor plate of WT sibling (E) and aln mutant (F) 24-h embryos. (G, H) Expression of c-ret in primary motoneurons in the ventral spinal cord of WT sibling (G) and aln mutant (H) 18-h embryos, double stained with trp-2. (I, J) Transverse sections through the midtrunk of WT sibling (I) and aln mutant (J) embryos stained for isl-2 expression at 24 h. Rohon-Beard primary sensory neurons (rb) and primary motoneurons (pmn) appear normal with respect to location within the neural keel, cell body number, and expression level of isl-2. EXPRESSION / LABELING:
PHENOTYPE:
|
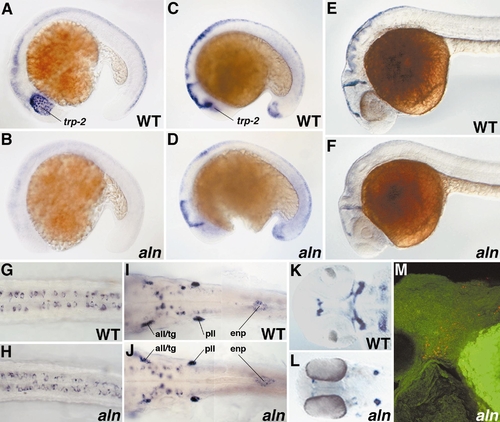
Development of the dorsal neuraxis and some derivatives. Prior to 24 h, aln mutant embryos were identified by simultaneous staining for trp-2 expression, which is greatly reduced in the mutant retina (A–D). (A, B) Expression of pax-3 in the dorsal one-third of the neural keel in WT sibling (A) and aln mutant (B) 18.5-h embryos, double stained with trp-2 (indicated in A). (C, D) Expression of wnt-1 at the dorsal midline of the neural keel in WT sibling (C) and aln mutant (D) 18-h embryos, double stained with trp-2 (indicated in C). (E, F) Expression of wnt-3A in WT sibling (E) and aln mutant (F) 24-h embryos. A–F indicate that several markers of dorsal neural tube identity are reduced in expression level in aln mutants. (G, H) isl-1 expression in dorsal spinal cord marks Rohon-Beard primary sensory neurons in WT sibling (G) and aln mutant (H) 24-h embryos, shown in dorsal view with anterior to the left. (I, J) WT (I) and mutant (J) 24-h embryos exhibit similar patterns of c-ret expression in cranial neural crest derivatives, shown in dorsal three focal plane composite views with anterior to the left. The trigeminal (tg), anterior lateral line (all), and posterior lateral line (pll) ganglia as well as the vagal neural crest-derived precursors of the enteric nervous system (enp) are detected in aln mutants. (K, L) Precursors of craniofacial cartilage, marked by goosecoid expression at 42 h, are present in abnormally small patches in mutant embryos (L), compared to similarly staged albino embryos (K). (M) DiI-labeled neural crest cells (red) in the branchial arch region of a 48-h mutant embryo. DiI was applied to the neural fold at the one- to two- somite stage and the embryo was imaged under two-color confocal microscopy using a Bodipy (green) counterstain. EXPRESSION / LABELING:
PHENOTYPE:
|
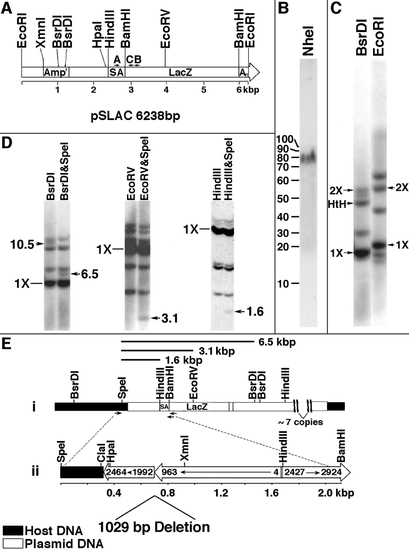
Molecular characterization of the aln insertion. (A) Diagram of pSLAC linearized at the unique EcoRI site. The origins of gene sequences present in pSLAC are described under Materials and Methods. A, B, and C refer to oligomer primers used for PCR. (B) Southern blot of aln/+ genomic DNA digested with NheI, which does not cleave pSLAC. Digested DNA was subjected to FIGE and probed with radiolabeled pSLAC sequences. (C) Southern blot of aln/+ DNA digested with BsrDI or EcoRI and probed with radiolabeled pSLAC sequences. 1X refers to unit size (6.0 kbp for BsrDI, 6.2 kbp for EcoRI), 2X refers to twice unit size, and HtH refers to the predicted size of the BsrDI fragment of two units arranged head to head. (D) Identification of host–insert junction fragments. aln/+ DNA was digested with the indicated enzymes, separated on 0.7 or 1% agarose gels, blotted, and probed with radiolabeled pSLAC. Candidate junction fragments are indicated by arrows with approximate sizes given in kilobasepairs. (E) Orientation of sequences at a host–insert junction. (i) Restriction map of host and plasmid-derived sequences at one junction. Junction fragments identified in D are indicated as bars above the map. Positions of primers used to amplify junction region are indicated by arrows below the map. (ii) Diagram of the 2.1-kbp junction fragment that was PCR amplified using primers denoted in i. Host-derived sequence (324 bp) is fused to portions of two plasmid units arranged tail to tail. One plasmid unit has an internal deletion of about 1 kbp, and the other plasmid unit has a terminal deletion of about 2.4 kbp. Numbers within the bars refer to basepair numbers of pSLAC indicated in A. |
Reprinted from Developmental Biology, 210(2), Cretekos, C.J. and Grunwald, D.J., alyron, an insertional mutation affecting early neural crest development in zebrafish, 322-338, Copyright (1999) with permission from Elsevier. Full text @ Dev. Biol.