
|
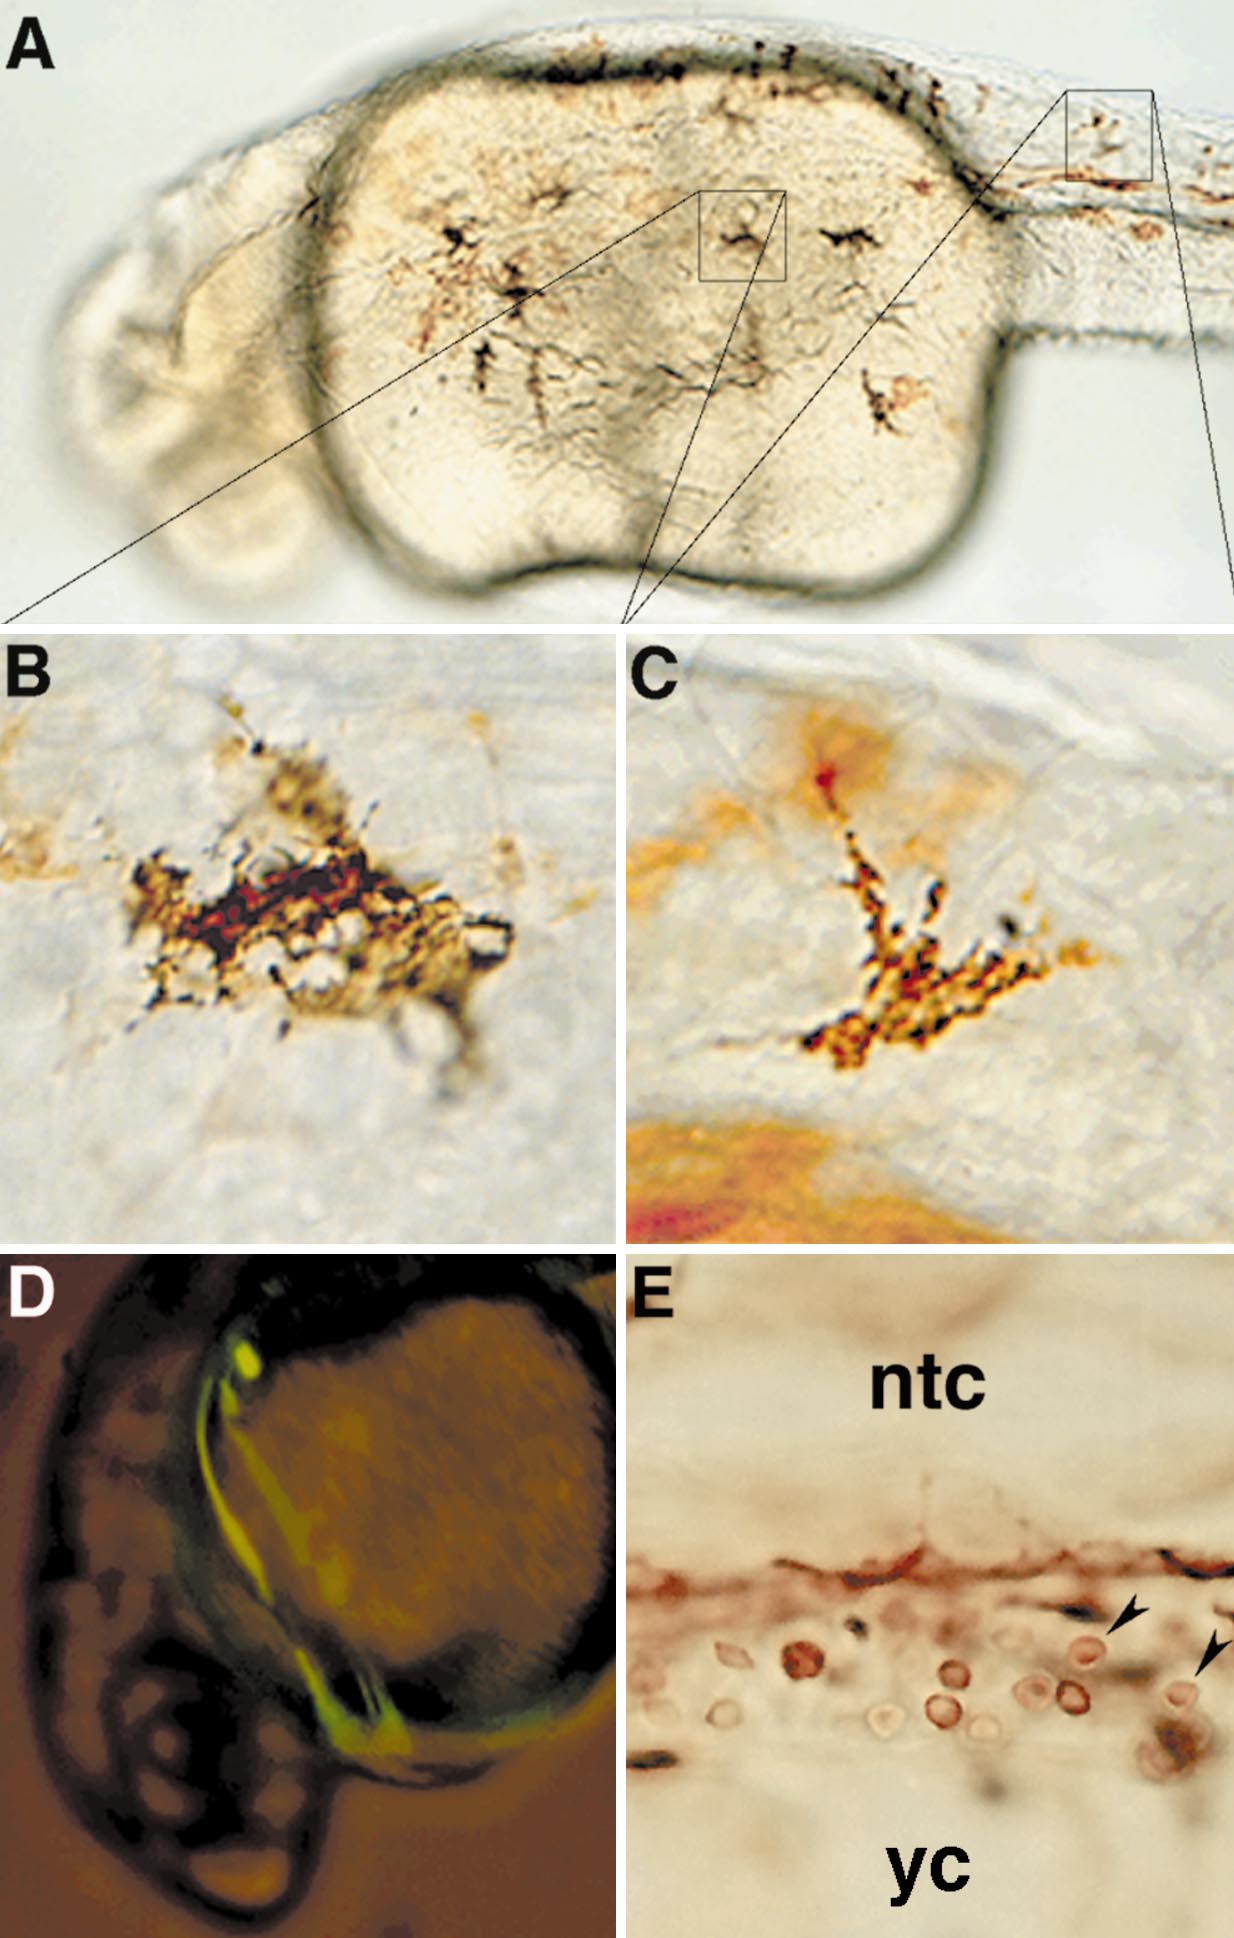
Fig. 2 Genetic mosaic analysis. (A) Dorsolateral view of a WT → aln 26-h mosaic that displayed melanophores. The FITC–dextran lineage tracer, indicating WT donor cells, has been detected immunohistochemically (brown). (B, C) Higher magnification views of two of the melanophores pictured in A, showing that WT donor cells (brown) produce melanophores displaying normal morphology and pigmentation (black) in aln hosts. (D) Backlit FITC epifluorescence view of a living aln → WT 26-h mosaic. The mutant donor cells that differentiated as blood circulate normally, indicated by the green streaks generated by the passage of labeled cells through the circulatory system during a long exposure. (E) High-magnification view of the intermediate cell mass region of a WT → aln mosaic (anterior to the left, dorsal to the top). The FITC–dextran lineage tracer has been detected immunohistochemically. WT cells (brown) that display typical erythroid morphology (arrowheads) fail to circulate and instead accumulate between the yolk cell (yc) and the notochord (ntc).
Reprinted from Developmental Biology, 210(2), Cretekos, C.J. and Grunwald, D.J., alyron, an insertional mutation affecting early neural crest development in zebrafish, 322-338, Copyright (1999) with permission from Elsevier. Full text @ Dev. Biol.