
- Title
-
Transcriptome profiling of tendon fibroblasts at the onset of embryonic muscle contraction reveals novel force-responsive genes
- Authors
- Nayak, P.K., Subramanian, A., Schilling, T.F.
- Source
- Full text @ Elife
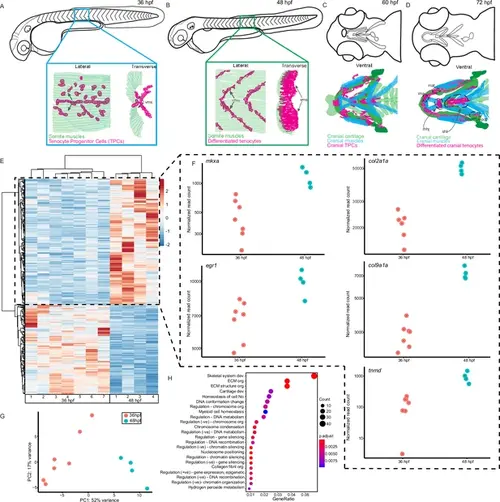
Onset of embryonic muscle contraction regulates transcription in tenocytes. (A–D) Diagrams depicting changes in tenocyte distribution and morphology during onset of trunk and cranial muscle contractions, (A) 36 hpf when twitching movements are sporadic and (B) 48 hpf when embryos become free swimming. Lateral views of 36 (A) and 48 hpf embryos (B). Insets show lateral and transverse views of migrating tenocyte progenitors (A) and differentiated tenocytes at somite boundaries with polarized, branched projections (B). Ventral views of the embryonic head in 60 hpf (C) and 72 hpf (D) embryos just prior to and during the onset of jaw movements. Cartilage (green), tenocytes (magenta), and muscles (cyan) showing tenocyte elongation, particularly in the sternohyoid tendon (sht) and condensation, as well as the mandibulohyoid junction (mhj). (E) Heatmaps from bulk RNA-sequencing (RNA-seq) showing the top 1000 differentially expressed genes (DEGs) between 36 and 48 hpf. p < 0.05. (F) Elevated expression of tenocyte marker genes mkxa, tnmd, and egr1 and extracellular matrix (ECM) genes col2a1a, col9a1a in RNA-seq experiments at 48 hpf. Datapoints represent normalized read counts of single biological replicates at each color-coded timepoint (n = 7 for 36 hpf, n = 4 for 48 hpf). (G) Elevated expression of cartilage marker genes col2a1a and col9a1a in 48 hpf samples. (H) PCA of individual replicates showing separation of experimental conditions by timepoint. (I) GO analysis using Biological Process (BP) terms of top 2788 DEGs by adjusted p-value. |
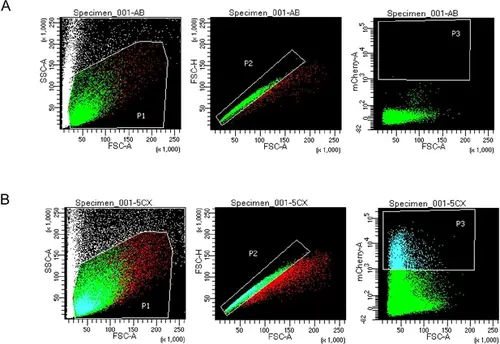
FACS gating thresholds for mCherry+ cells. (Left to right for each) Forward Scatter A (FSC-A) versus Side Scatter A (SSC-A) shows P1 threshold. FSC-A versus Forward Scatter H (FSC-H) shows P2 threshold to select for single cells. FSC-A versus mCherry-A shows P3 fluorescence gating for mCherry+ cells. (A) P3 selection gating allowed selection of cells with strong mCherry signal based on Negative control AB (WT) sample versus mCherry expressing tenocytes (48 hpf) FACS gating. Established P3 gating selected for mCherry-positive cells in all 36 and 48 hpf Tg(scxa:mCherry) samples. (B) Thresholds used in 36 and 48 hpf Tg(scxa:mCherry) samples for FACS prior to bulk RNA-sequencing (RNA-seq). |
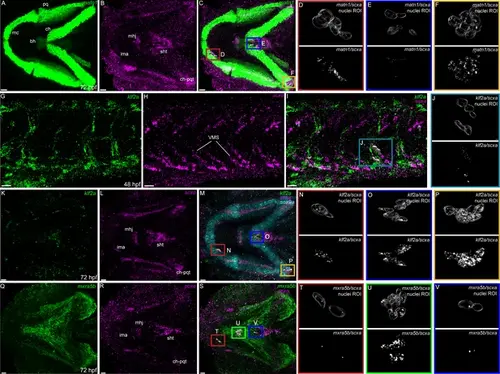
Expression of matn1, klf2a, and mxra5b with scxa in cranial and trunk tenocytes. Ventral cranial (A–F, K–V) and lateral trunk (G–J) views of 72 hpf (A–F, K–V) and 48 hpf (G–J) embryos showing isHCR of matn1 (A, C–F), klf2a (G, I–K, M–P), and mxra5b (Q, S–V) in combination with scxa (B–F, H–J, L–P, R–V). (D–F, J, N–P, T–V) Higher magnification views of tenocyte nuclei in marked ROI. (C, D, M, N, S, T) ROI and panels outlined in magenta show magnified views of 3D volumes of tenocytes associated with imt. (I, J) ROI and panels outlined in cyan show magnified views of 3D volume of VMS tenocytes. (C, E, M, O, S, V) ROI and panels outlined in royal blue show magnified views of 3D volume of tenocytes associated with sht enthesis. (C, F, M, P) ROI and panels outlined in yellow show magnified views of 3D volumes of tenocytes associated with ch-pqt. (S, U) ROI and panels outlined in green show magnified views of 3D volumes of tenocytes associated with mhj. Each magnified view of ROI displays a translucent outline of the nuclear 3D volume with white puncta representing voxel colocalizations of isHCR as depicted by the colocalization function in Imaris (see Methods). mc – Meckel’s cartilage, pq – palatoquadrate, ch – ceratohyal, bh – basihyal cartilage, ima – intermadibularis anterior tendon, mhj – mandibulohyoid junction, sht – sternohyoideus tendon, ch-pqt – ceratohyal-palatoquadrate tendon, sb – somite boundary. Scale bars = 20 µm. |
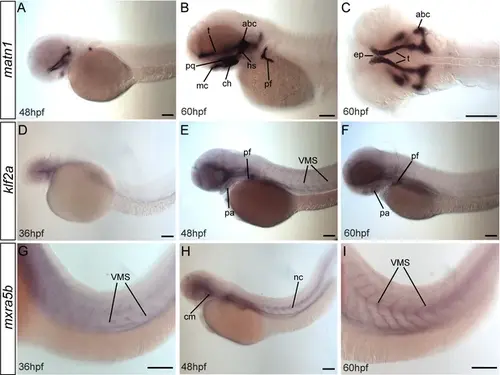
matn1, klf2a, and mxra5b are expressed in musculoskeletal tissues of developing embryos. Lateral (A, B, D–I) and ventral (C) views of embryos showing expression of matn1 (A–C), klf2a (D–F), and mxra5b (G, H). (A–C) 48 hpf embryos show matn1 expression in cartilage progenitors at 48 hpf and in differentiated cartilages (and associated tenocytes) at 60 hpf (B, C). Lateral views of 36 hpf (D), 48 hpf (E), and 60 hpf (F) embryos show klf2a expression in pharyngeal mesenchyme (D), skeletal progenitors and in tenocytes along VMS (E, F). Lateral views of 36 hpf (G), 48 hpf (H), and 60 hpf (I) embryos show mxra5b expression in tenocytes along horizontal myosepta (HMS) along the notochord and VMS. Scale bars = 100 μm. Abbreviations: abc = anterior basicranial commissure, ch = ceratohyal cartilage, ep = ethmoid plate, hs = hyosymplectic cartilage, mc = meckel’s cartilage, nc = notochord, pf = pectoral fin, pq = palatoquadrate cartilage, sb = somite boundaries, t = trabeculae cartilage. |
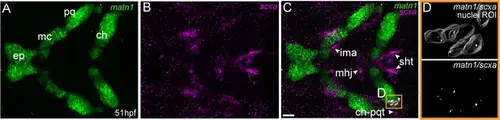
matn1 is expressed in differentiating cranial tenocytes. Ventral view of the developing mandibular arch in a 51 hpf embryo showing in situ Hybridization Chain Reaction (isHCR) of matn1 (A, C, D) and scxa (B–D). (D) magnified view of yellow ROI (C) shows outline of tenocyte nuclear 3D volume with white puncta representing voxel colocalizations of matn1 and scxa as depicted by colocalization using Imaris (see methods). ep = ethmoid plate cartilage, ch = ceratohyal cartilage, mc = meckel’s cartilage, pq = palatoquadrate cartilage, ch-pqt = ceratohyal-palatoquadrate tendon, ima = intermandibularis anterior tendon, mhj = mandibulohyoid junction tendon, sht = sternohyoideus tendon. Scale bars = 20 µm. |
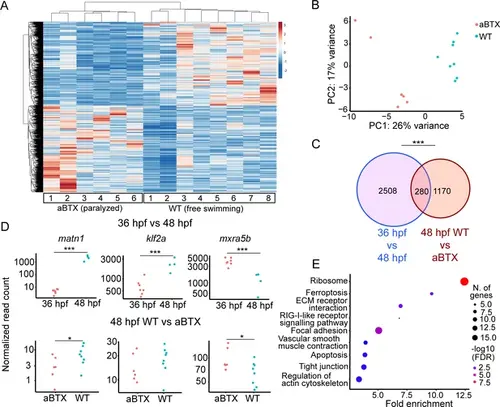
Paralysis regulates tenocyte gene expression in developing musculoskeletal system. (A) Heatmap of differentially expressed genes (DEGs) from bulk RNA-sequencing (RNA-seq) between WT and aBTX-injected (aBTX-inj) paralyzed 48 hpf embryos (force perturbed). (B) PCA of individual replicates WT versus aBTX-inj embryos’ RNA-seq separate by experimental condition. (C) Venn diagram shows overlap of genes between developmental time-point and force perturbed RNA-seq experiments. (D) Comparison of normalized read counts between replicates of matn1, klf2a, and mxra5b in 36 versus 48 hpf and WT versus aBTX RNA-seq experiments. (E) KEGG pathway analysis plot shows enrichment of overlapping genes from (C). ns = not significant, *p < 0.05, ***p < 0.001. |
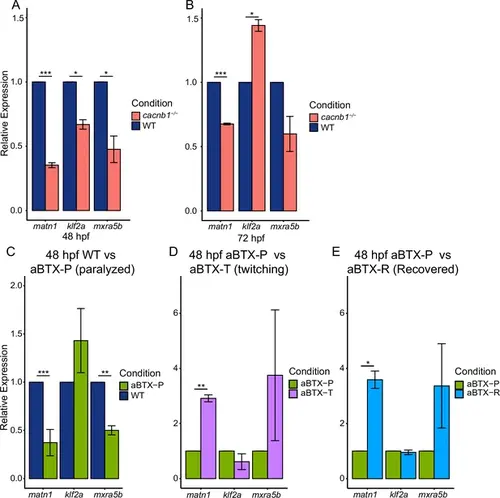
Paralysis regulates gene expression of matn1, klf2a, and mxra5b in developing embryos. Bar plots showing global changes in relative expression from RT-qPCR of matn1, klf2a, and mxra5b genes between WT and cacnb1−/− mutant embryos at 48 hpf (A) and 72 hpf (B). Bar plots show global changes in relative expression of matn1, klf2a, and mxra5b between 48 hpf uninjected WT controls (blue) and aBTX-injected paralyzed (green) embryos (C), aBTX-injected paralyzed (green) and aBTX-injected ‘Twitching’ (partially recovered, magenta) embryos (D), and between aBTX-injected paralyzed (green) and aBTX-injected, ‘Recovered’ (cyan) embryos (E) at 48 hpf (right). ns = not significant, *p < 0.05, **p < 0.01, ***p < 0.001. |
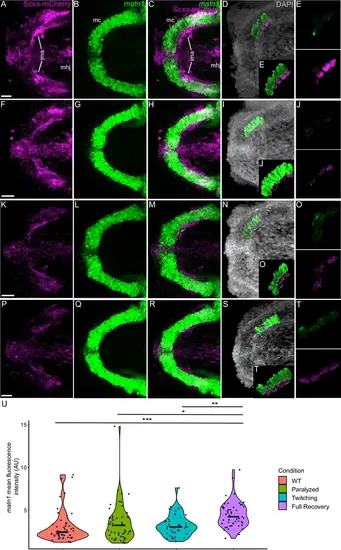
Mechanical force differentially regulates expression of matn1 in ima enthesis tenocytes. Ventral views of Meckel’s cartilage and associated tenocytes showing in situ Hybridization Chain Reaction (isHCR) of matn1 (green) and anti-mCherry immunofluorescence (magenta) marking the tenocytes in Tg(scxa:mCherry) embryos at 72 hpf in WT uninjected (WT) (A–E), aBTX-inj (Paralyzed) (F–J), partially recovered aBTX-inj (Twitching) (K–O), and completely recovered aBTX-inj (Full Recovery) (P–T) conditions at ima enthesis. (D, I, N, S) Grayscale images showing nuclei stained with DAPI with ROIs showing isolated 3D volumes of chondrocytes (green) and enthesis tenocytes (magenta) based on DAPI signal. (E, J, O, T) Insets showing magnified views of the 3D volumes of tenocytes associated with ima enthesis depicting expression of matn1 and stained for mCherry. (U) Violin plot showing changes in mean fluorescence intensity of matn1 in ima enthesis tenocyte nuclei between WT (n = 8), Paralyzed (n = 8), Twitching (n = 6), and Full Recovery (n = 7) with ~8 nuclei measured per embryo. p-value calculated with linear mixed effects model with Tukey post hoc test. *p < 0.05, **p < 0.01, ***p < 0.001. Scale bars = 20 µm. |
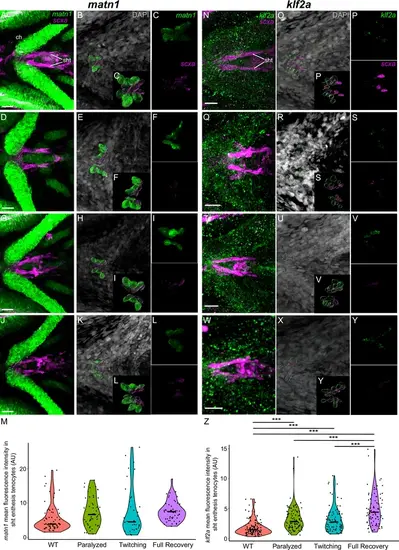
Mechanical force regulates expression of matn1 and klf2a in sht enthesis tenocytes. Ventral views of ceratohyal (ch) cartilage and associated tenocytes showing in situ Hybridization Chain Reaction (isHCR) of matn1 (green) (A–L) and klf2a (green) (N–Y) and anti-mCherry immunofluorescence (magenta) marking the tenocytes in Tg(scxa:mCherry) embryos at 72 hpf in WT uninjected (WT) (A–C, N–P), aBTX-inj (Paralyzed) (D–F, Q–S), partially recovered aBTX-inj (Twitching) (G–I, T–V), and completely recovered aBTX-inj (Full Recovery) (J–L, W–Y) conditions at sht enthesis. (B, E, H, K, O, R, U, X) Grayscale images showing nuclei stained with DAPI with ROIs showing isolated 3D volumes of chondrocytes (green) and sternohyoideus-ceratohyal (sht) enthesis tenocytes (magenta) based on DAPI signal. (C, F, I, L, P, S, V, Y) Insets showing magnified views of the 3D volumes of tenocytes associated with sht enthesis depicting expression of matn1 and stained for mCherry. (M) Violin plot showing changes in mean fluorescence intensity of matn1 in sht enthesis tenocyte nuclei between WT (n = 8), Paralyzed (n = 8), Twitching (n = 6), and Full Recovery (n = 7) with ~8 nuclei measured per embryo. (Z) Violin plot showing changes in mean fluorescence intensity of klf2a in sht enthesis tenocyte nuclei between WT (n = 15), Paralyzed (n = 16), Twitching (n = 14), and Full Recovery (n = 11) with ~8 nuclei measured per embryo. p-values calculated with linear mixed effects model with Tukey post hoc test. ***p < 0.001. Scale bars = 20 µm. |
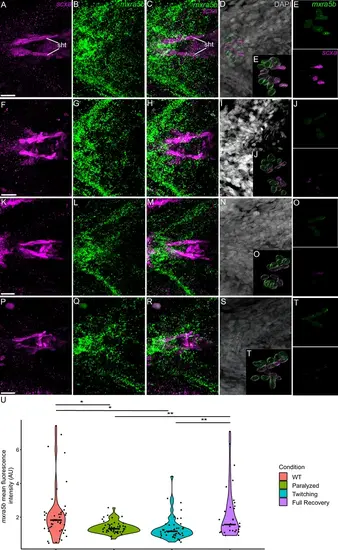
Mechanical force differentially regulates expression of mxra5b in sht enthesis tenocytes. Ventral views of ceratohyal (ch) cartilage and associated tenocytes showing in situ Hybridization Chain Reaction (isHCR) of mxra5b (green) and anti-mCherry immunofluorescence (magenta) marking the tenocytes in Tg(scxa:mCherry) embryos at 72 hpf in WT uninjected (WT) (A–E), aBTX-inj paralyzed (F–J), partially recovered aBTX-inj (Twitching) (K–O), and completely recovered aBTX-inj (Full Recovery) (P–T) conditions at sht enthesis. (D, I, N, S) Grayscale images showing nuclei stained with DAPI with ROIs showing isolated 3D volumes of chondrocytes (green) and sht enthesis tenocytes (magenta) based on DAPI signal. (E, J, O, T) Insets showing magnified views of the 3D volumes of tenocytes associated with sht enthesis depicting expression of mxra5b and stained for mCherry. (U) Violin plot showing changes in mean fluorescence intensity of mxra5b in sht enthesis tenocyte nuclei between WT (n = 7), Paralyzed (n = 8), Twitching (n = 8), and Full Recovery (n = 4) with ~8 nuclei measured per embryo. p-value calculated with linear mixed effects model with Tukey post hoc test. *p < 0.05, **p < 0.01. Scale bars = 20 µm. |
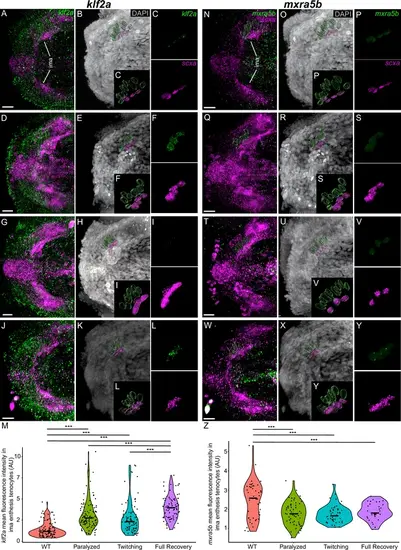
Mechanical force differentially regulates expression of mxra5b and klf2a in ima enthesis tenocytes. Ventral views of Meckels cartilage and associated tenocytes showing in situ Hybridization Chain Reaction (isHCR) of klf2a (green) (A–L) and mxra5b (green) (N–Y) and anti-mCherry immunofluorescence (magenta) marking the tenocytes in Tg(scxa:mCherry) embryos at 72 hpf in WT uninjected (WT) (A–C, N–P), aBTX-inj (Paralyzed) (D–F, Q–S), partially recovered aBTX-inj (Twitching) (G–I, T–V), and completely recovered aBTX-inj (Full Recovery) (J–L, W–Y) conditions at ima enthesis. (B, E, H, K, O, R, U, X) Grayscale images showing nuclei stained with DAPI with ROIs showing isolated 3D volumes of chondrocytes (green) and ima enthesis tenocytes (magenta) based on DAPI signal. (C, F, I, L, P, S, V, Y) Insets showing magnified views of the 3D volumes of tenocytes associated with ima enthesis depicting expression of mxra5b and klf2a and stained for mCherry. (M) Violin plot showing changes in mean fluorescence intensity of klf2a in ima enthesis tenocyte nuclei between WT (n = 15), Paralyzed (n = 16), Twitching (n = 14), and Full Recovery (n = 11) with ~8 nuclei measured per embryo. (Z) Violin plot showing changes in mean fluorescence intensity of mxra5b in ima enthesis tenocyte nuclei between WT (n = 7), Paralyzed (n = 8), Twitching (n = 8), and Full Recovery (n = 4) with ~8 nuclei measured per embryo. p-values calculated with linear mixed effects model with Tukey post hoc test. ***p < 0.001. Scale bars = 20 µm. |
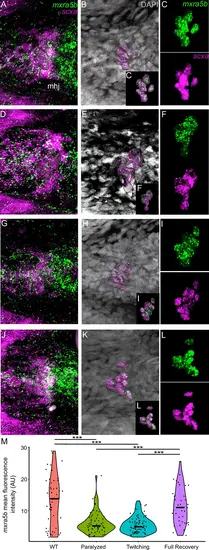
Mechanical force regulates expression of mxra5b in mhj myotendinous junction tenocytes. Ventral views of mandibulohyoid (mhj) myotendinous junction (MTJ) associated tenocytes showing in situ Hybridization Chain Reaction (isHCR) of mxra5b (green) and anti-mCherry immunofluorescence (magenta) marking the tenocytes in Tg(scxa:mCherry) embryos at 72 hpf in WT uninjected (WT) (A–C), aBTX-inj (Paralyzed) (D–F), partially recovered aBTX-inj (Twitching) (G–I), and completely recovered aBTX-inj (Full Recovery) (J–L) conditions. (B, E, H, K) Grayscale images showing nuclei stained with DAPI with ROIs showing isolated 3D volumes of mhj tenocytes (magenta) based on DAPI signal. (C, F, I, L) Insets showing magnified views of the 3D volumes of tenocytes associated with mhj MTJ depicting expression of mxra5b and stained for mCherry. (M) Violin plot showing changes in mean fluorescence intensity of mxra5b in mhj MTJ tenocyte nuclei between WT (n = 7), Paralyzed (n = 8), Twitching (n = 8), and Full Recovery (n = 4) with ~10 nuclei measured per embryo. p-value calculated with linear mixed effects model with Tukey post hoc test. ***p < 0.001. Scale bars = 20 µm. |
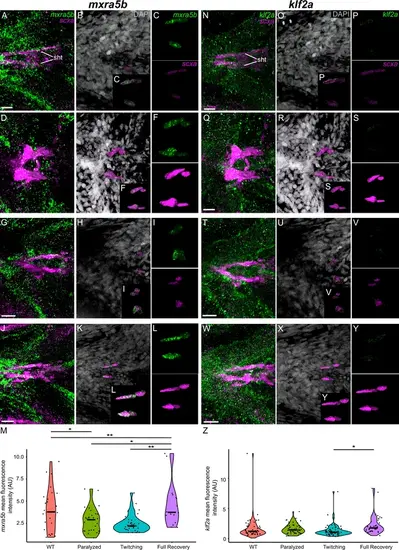
Mechanical force differentially regulates expression of mxra5b and klf2a in sht myotendinous junction tenocytes. Ventral views of sht and associated myotendinous junction (MTJ) Tenocytes showing in situ Hybridization Chain Reaction (isHCR) of mxra5b (green) (A–L) and klf2a (green) (N–Y) and anti-mCherry immunofluorescence (magenta) marking the tenocytes in Tg(scxa:mCherry) embryos at 72 hpf in WT uninjected (WT) (A–C, N–P), aBTX-inj (Paralyzed) (D–F, Q–S), partially recovered aBTX-inj (Twitching) (G–I, T–V), and completely recovered aBTX-inj (Full Recovery) (J–L, W–Y) conditions at sht MTJ. (B, E, H, K, O, R, U, X) Grayscale images showing nuclei stained with DAPI with ROIs showing isolated 3D volumes of ima enthesis tenocytes (magenta) based on DAPI signal. (C, F, I, L, P, S, V, Y) Insets showing magnified views of the 3D volumes of tenocytes associated with sht enthesis depicting expression of mxra5b and klf2a and stained for mCherry. (M) Violin plot showing changes in mean fluorescence intensity of mxra5b in sht MTJ tenocyte nuclei between WT (n = 7), Paralyzed (n = 8), Twitching (n = 8), and Full Recovery (n = 4) with ~4 nuclei measured per embryo. (Z) Violin plot showing changes in mean fluorescence intensity of klf2a in ima enthesis tenocyte nuclei between WT (n = 15), Paralyzed (n = 16), Twitching (n = 14), and Full Recovery (n = 11) with ~4 nuclei measured per embryo. p-values calculated with linear mixed effects model with Tukey post hoc test. *p < 0.05, **p < 0.01. Scale bars = 20 µm. |
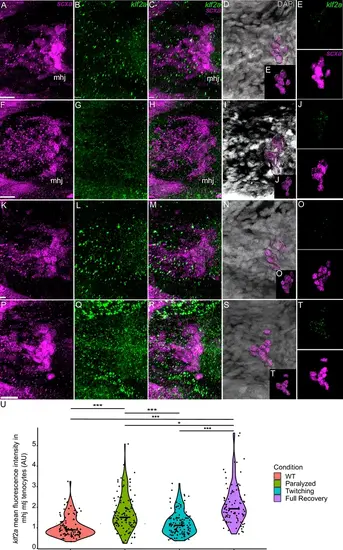
Mechanical force regulates expression of klf2a in mhj myotendinous junction tenocytes. Ventral views of mandibulohyoid junction (mhj), myotendinous junction (MTJ) associated tenocytes showing in situ Hybridization Chain Reaction (isHCR) of klf2a (green) and anti-mCherry immunofluorescence (magenta) marking the tenocytes in Tg(scxa:mCherry) embryos at 72 hpf in WT uninjected (WT) (A–E), aBTX-inj (Paralyzed) (F–J), partially recovered aBTX-inj (Twitching) (K–O), and completely recovered aBTX-inj (Full Recovery) (P–T) conditions. (D, I, N, S) Grayscale images showing nuclei stained with DAPI with ROIs showing isolated 3D volumes of mhj tenocytes (magenta) based on DAPI signal. (E, J, O, T) Insets showing magnified views of the 3D volumes of tenocytes associated with mhj MTJ depicting expression of klf2a and stained for mCherry. (U) Violin plot showing changes in mean fluorescence intensity of klf2a in mhj MTJ tenocyte nuclei between WT (n = 17), Paralyzed (n = 15), Twitching (n = 14), and Full Recovery (n = 11) with ~10 nuclei measured per embryo. p-value calculated with linear mixed effects model with Tukey post hoc test. *p < 0.05, ***p < 0.001. Scale bars = 20 µm. |
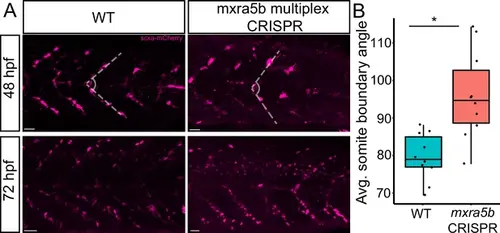
Loss of mxra5b function affects somite boundary structure. (A) Lateral views of WT and mxra5b multiplex CRISPants at 48 and 72 hpf Tg(scx:mCherry) embryos stained with anti-mCherry to show tenocytes at the somite boundary (SB). (B) Quantification of somite boundary angle measurements of 48 hpf WT or mxra5b multiplex CRISPant embryos. p-value calculated with Watson’s U2 test. *p < 0.05. |
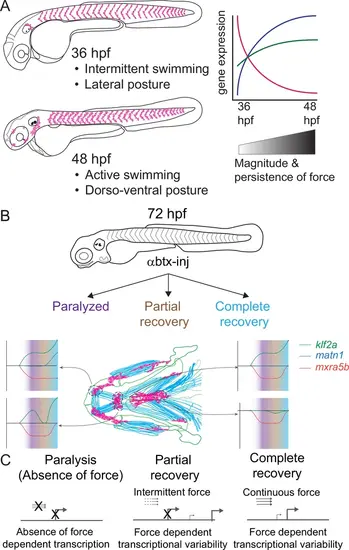
Model depicting role of mechanical force in regulating expression of genes in tenocytes during onset of active muscle contraction. (A) Cartoon showing role of force in regulating tenocyte morphogenesis and gene expression in tenocytes between 36 and 48 hpf stages correlating with onset of active swimming The variability in gene expression is related to increase in both magnitude and persistence of muscle contraction force. (B) Representative model summarizing the multifaceted role of muscle contractile force on expression dynamics of matn1, klf2a, and mxra5b genes in cranial tendon attachments. (C) Force-responsive gene expression is more nuanced than a binary on/off control. |