
|
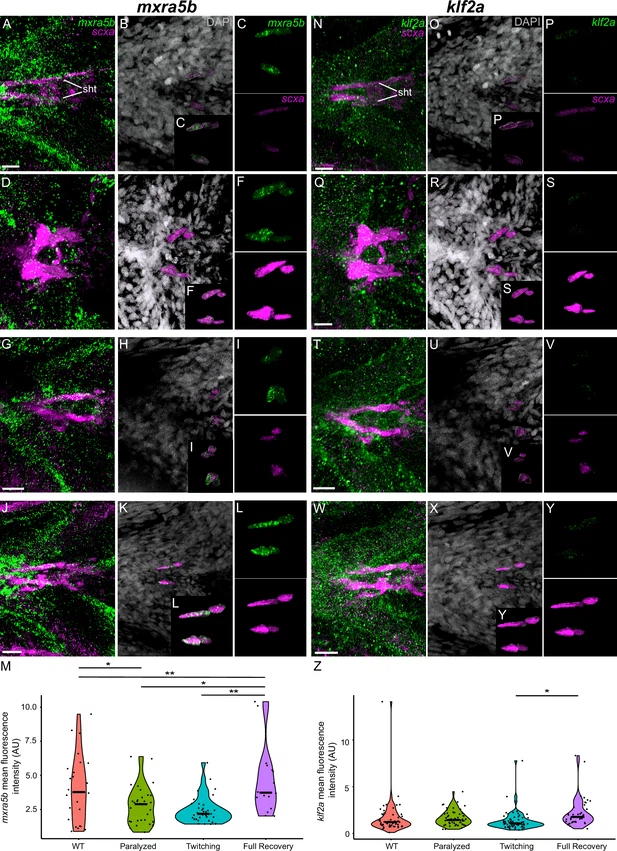
Fig. 5 - Supplement 3 Mechanical force differentially regulates expression of mxra5b and klf2a in sht myotendinous junction tenocytes. Ventral views of sht and associated myotendinous junction (MTJ) Tenocytes showing in situ Hybridization Chain Reaction (isHCR) of mxra5b (green) (A–L) and klf2a (green) (N–Y) and anti-mCherry immunofluorescence (magenta) marking the tenocytes in Tg(scxa:mCherry) embryos at 72 hpf in WT uninjected (WT) (A–C, N–P), aBTX-inj (Paralyzed) (D–F, Q–S), partially recovered aBTX-inj (Twitching) (G–I, T–V), and completely recovered aBTX-inj (Full Recovery) (J–L, W–Y) conditions at sht MTJ. (B, E, H, K, O, R, U, X) Grayscale images showing nuclei stained with DAPI with ROIs showing isolated 3D volumes of ima enthesis tenocytes (magenta) based on DAPI signal. (C, F, I, L, P, S, V, Y) Insets showing magnified views of the 3D volumes of tenocytes associated with sht enthesis depicting expression of mxra5b and klf2a and stained for mCherry. (M) Violin plot showing changes in mean fluorescence intensity of mxra5b in sht MTJ tenocyte nuclei between WT (n = 7), Paralyzed (n = 8), Twitching (n = 8), and Full Recovery (n = 4) with ~4 nuclei measured per embryo. (Z) Violin plot showing changes in mean fluorescence intensity of klf2a in ima enthesis tenocyte nuclei between WT (n = 15), Paralyzed (n = 16), Twitching (n = 14), and Full Recovery (n = 11) with ~4 nuclei measured per embryo. p-values calculated with linear mixed effects model with Tukey post hoc test. *p < 0.05, **p < 0.01. Scale bars = 20 µm.