
|
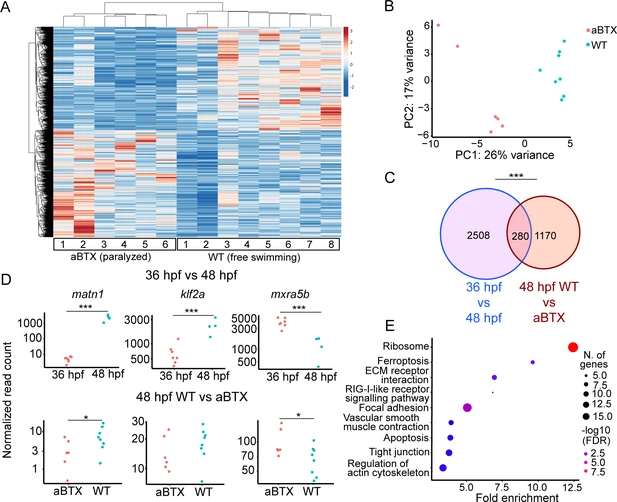
Fig. 3 Paralysis regulates tenocyte gene expression in developing musculoskeletal system. (A) Heatmap of differentially expressed genes (DEGs) from bulk RNA-sequencing (RNA-seq) between WT and aBTX-injected (aBTX-inj) paralyzed 48 hpf embryos (force perturbed). (B) PCA of individual replicates WT versus aBTX-inj embryos’ RNA-seq separate by experimental condition. (C) Venn diagram shows overlap of genes between developmental time-point and force perturbed RNA-seq experiments. (D) Comparison of normalized read counts between replicates of matn1, klf2a, and mxra5b in 36 versus 48 hpf and WT versus aBTX RNA-seq experiments. (E) KEGG pathway analysis plot shows enrichment of overlapping genes from (C). ns = not significant, *p < 0.05, ***p < 0.001.