
|
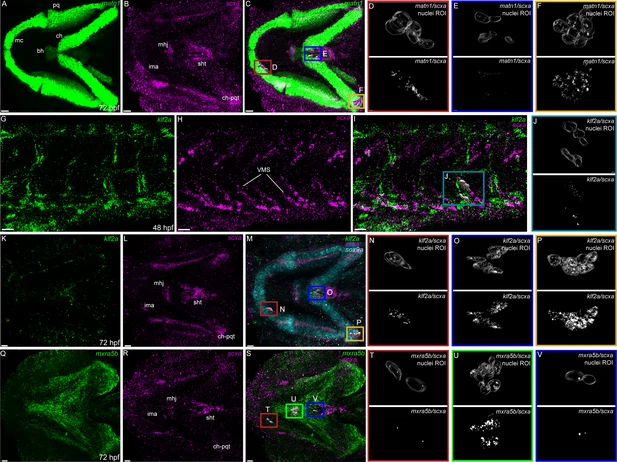
Fig. 2 Expression of matn1, klf2a, and mxra5b with scxa in cranial and trunk tenocytes. Ventral cranial (A–F, K–V) and lateral trunk (G–J) views of 72 hpf (A–F, K–V) and 48 hpf (G–J) embryos showing isHCR of matn1 (A, C–F), klf2a (G, I–K, M–P), and mxra5b (Q, S–V) in combination with scxa (B–F, H–J, L–P, R–V). (D–F, J, N–P, T–V) Higher magnification views of tenocyte nuclei in marked ROI. (C, D, M, N, S, T) ROI and panels outlined in magenta show magnified views of 3D volumes of tenocytes associated with imt. (I, J) ROI and panels outlined in cyan show magnified views of 3D volume of VMS tenocytes. (C, E, M, O, S, V) ROI and panels outlined in royal blue show magnified views of 3D volume of tenocytes associated with sht enthesis. (C, F, M, P) ROI and panels outlined in yellow show magnified views of 3D volumes of tenocytes associated with ch-pqt. (S, U) ROI and panels outlined in green show magnified views of 3D volumes of tenocytes associated with mhj. Each magnified view of ROI displays a translucent outline of the nuclear 3D volume with white puncta representing voxel colocalizations of isHCR as depicted by the colocalization function in Imaris (see Methods). mc – Meckel’s cartilage, pq – palatoquadrate, ch – ceratohyal, bh – basihyal cartilage, ima – intermadibularis anterior tendon, mhj – mandibulohyoid junction, sht – sternohyoideus tendon, ch-pqt – ceratohyal-palatoquadrate tendon, sb – somite boundary. Scale bars = 20 µm.