
Fig. 1 - Supplement 1
- ID
- ZDB-FIG-250523-27
- Publication
- Nayak et al., 2025 - Transcriptome profiling of tendon fibroblasts at the onset of embryonic muscle contraction reveals novel force-responsive genes
- Other Figures
- All Figure Page
- Back to All Figure Page
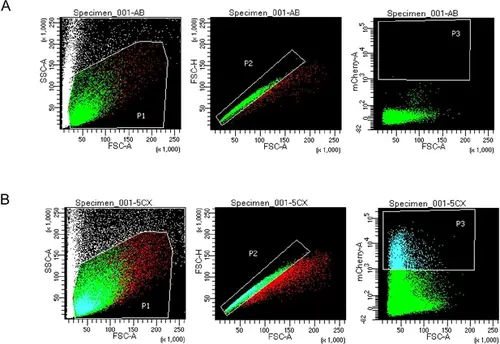
FACS gating thresholds for mCherry+ cells. (Left to right for each) Forward Scatter A (FSC-A) versus Side Scatter A (SSC-A) shows P1 threshold. FSC-A versus Forward Scatter H (FSC-H) shows P2 threshold to select for single cells. FSC-A versus mCherry-A shows P3 fluorescence gating for mCherry+ cells. (A) P3 selection gating allowed selection of cells with strong mCherry signal based on Negative control AB (WT) sample versus mCherry expressing tenocytes (48 hpf) FACS gating. Established P3 gating selected for mCherry-positive cells in all 36 and 48 hpf Tg(scxa:mCherry) samples. (B) Thresholds used in 36 and 48 hpf Tg(scxa:mCherry) samples for FACS prior to bulk RNA-sequencing (RNA-seq). |