
Fig. 4 - Supplement 1
- ID
- ZDB-FIG-250523-34
- Publication
- Nayak et al., 2025 - Transcriptome profiling of tendon fibroblasts at the onset of embryonic muscle contraction reveals novel force-responsive genes
- Other Figures
- All Figure Page
- Back to All Figure Page
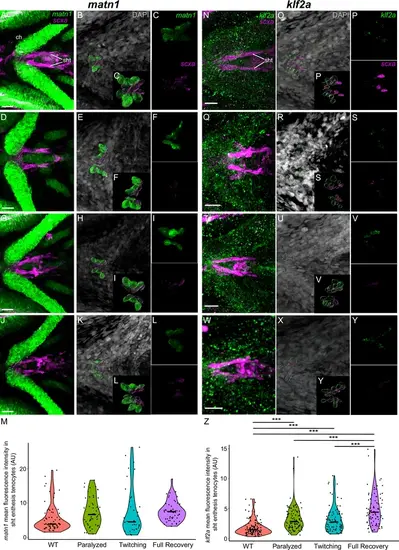
Mechanical force regulates expression of matn1 and klf2a in sht enthesis tenocytes. Ventral views of ceratohyal (ch) cartilage and associated tenocytes showing in situ Hybridization Chain Reaction (isHCR) of matn1 (green) (A–L) and klf2a (green) (N–Y) and anti-mCherry immunofluorescence (magenta) marking the tenocytes in Tg(scxa:mCherry) embryos at 72 hpf in WT uninjected (WT) (A–C, N–P), aBTX-inj (Paralyzed) (D–F, Q–S), partially recovered aBTX-inj (Twitching) (G–I, T–V), and completely recovered aBTX-inj (Full Recovery) (J–L, W–Y) conditions at sht enthesis. (B, E, H, K, O, R, U, X) Grayscale images showing nuclei stained with DAPI with ROIs showing isolated 3D volumes of chondrocytes (green) and sternohyoideus-ceratohyal (sht) enthesis tenocytes (magenta) based on DAPI signal. (C, F, I, L, P, S, V, Y) Insets showing magnified views of the 3D volumes of tenocytes associated with sht enthesis depicting expression of matn1 and stained for mCherry. (M) Violin plot showing changes in mean fluorescence intensity of matn1 in sht enthesis tenocyte nuclei between WT (n = 8), Paralyzed (n = 8), Twitching (n = 6), and Full Recovery (n = 7) with ~8 nuclei measured per embryo. (Z) Violin plot showing changes in mean fluorescence intensity of klf2a in sht enthesis tenocyte nuclei between WT (n = 15), Paralyzed (n = 16), Twitching (n = 14), and Full Recovery (n = 11) with ~8 nuclei measured per embryo. p-values calculated with linear mixed effects model with Tukey post hoc test. ***p < 0.001. Scale bars = 20 µm. |